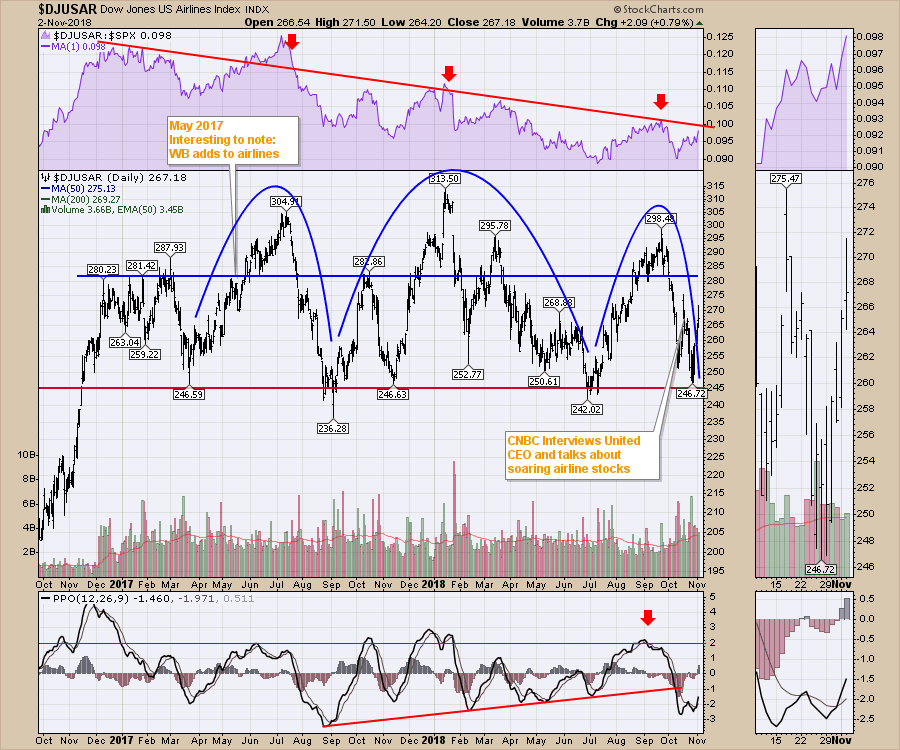
The airline stocks have been mudding around. They have stayed in a giant trading range. I noted on my chart last year Warren Buffet had been buying airline stocks. Well, its been a zero gain trade. The airlines bounced last week at support and are bouncing up. One consideration is the $15 drop in Crude could help the airline margins for the fourth quarter.
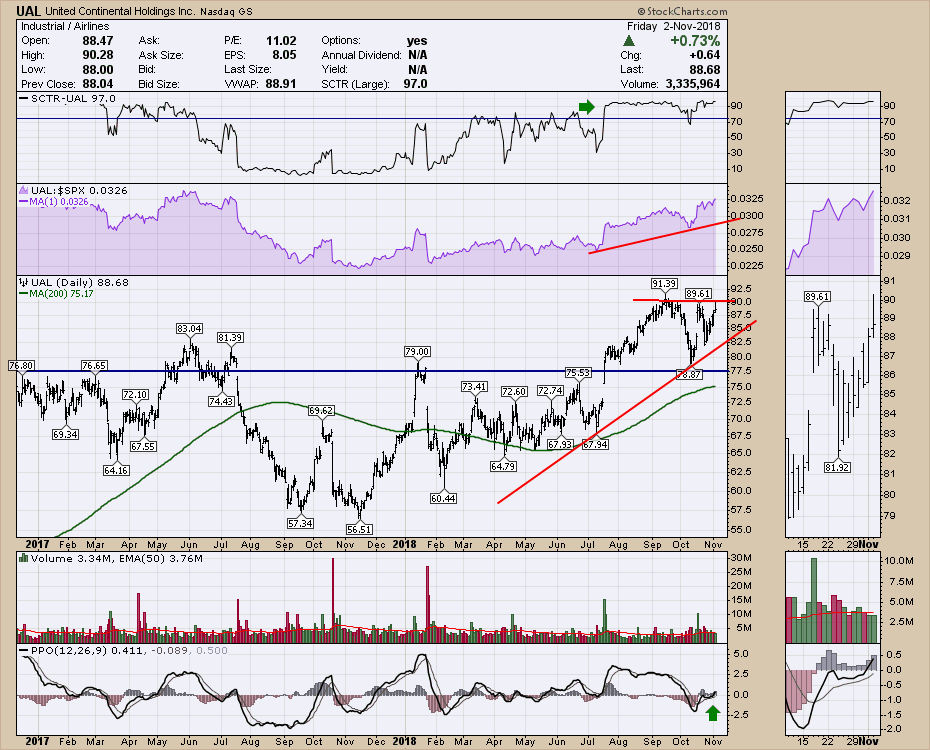
 One of the better airline charts is United Airlines (UAL). The chart has had a strong SCTR recently. It broke above horizontal support at $77.50 in mid October and has now bounced up to retest the highs. The improvement in relative strength is particularly encouraging. It is making new 12 month RS highs.
 To finish the chart the PPO is pushing back into positive territory. It's tough trading right now with the high volatility on the indexes. Keep stops very tight and manage position sizing so no specific trade hurts your account in a big way.
Here is this week's video.
I have included some scans to help you find some nice setups near these lows.
The Canadian Technician video shows the massive breakdown on almost every sector chart in Canada. Canada is back below the 2008 highs. Tough ten years for investors.
If you are looking for a small gift, you might have family or friends that would like to learn more about the basics of charting. The first section of the book walks through all the chart settings to get the charts you want. The second section is why you might use charts for investing and the third section is putting it all together.
Click here to buy your copy today! Stock Charts For Dummies.
If you are missing intermarket signals in the market, follow me on Twitter and check out my Vimeo Channel often. Bookmark it for easy access!
Good trading,
Greg Schnell, CMT, MFTA
Senior Technical Analyst, StockCharts.com
Author, Stock Charts for Dummies
Hey, have you followed me on Twitter? Click the bird in the box below!
Want to read more from Greg? Be sure to follow his StockCharts blog:
The Canadian Technician
