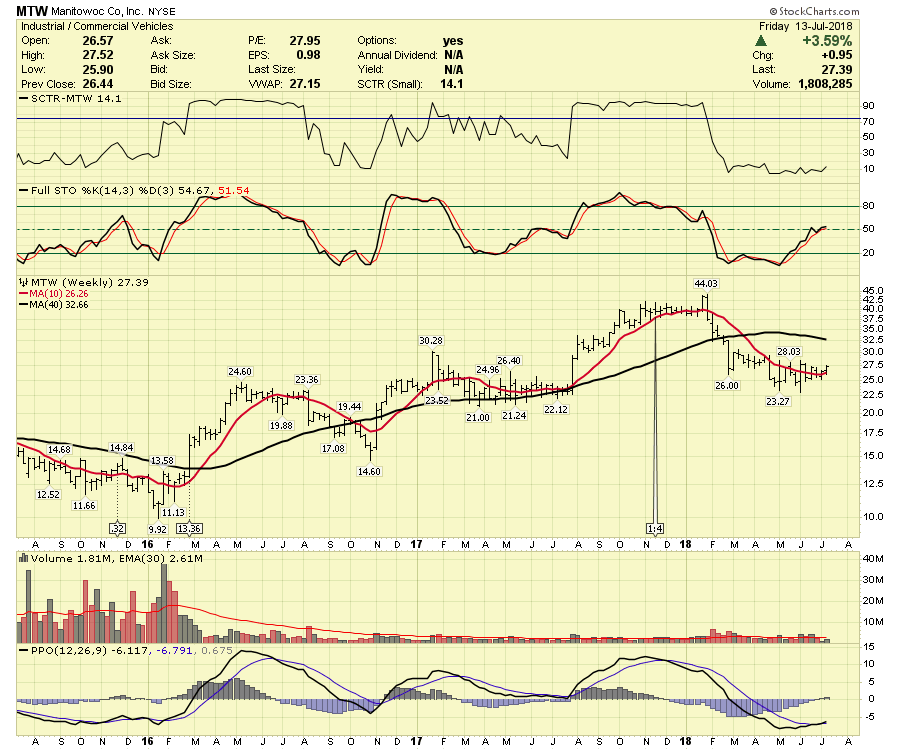
Manitowoc is trying to break the downward trend. There are a few bullish signals on the chart. The Full Stochastic is moving above 50. The PPO is kicking off a buy signal this week. There is a little four month trend across the highs on the chart that could quickly be broken with a sudden surge. Late July 2017 was a fabulous surge to get on board for a 40% move.
If you are missing clues on signals in the market, follow me on Twitter and check out my Vimeo Channel often.
Bookmark it for easy access!
Good trading,
Greg Schnell, CMT, MFTA
Senior Technical Analyst, StockCharts.com
Author, Stock Charts for Dummies
Want to read more from Greg? Be sure to follow his two StockCharts blogs:
Commodities Countdown and The Canadian Technician

