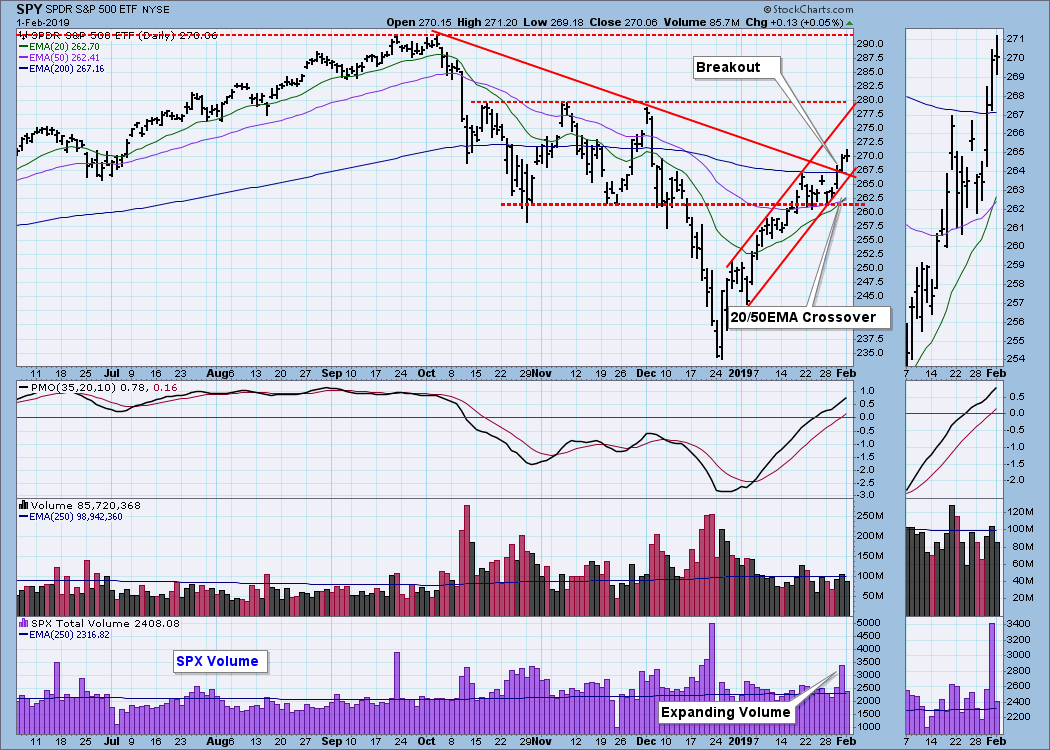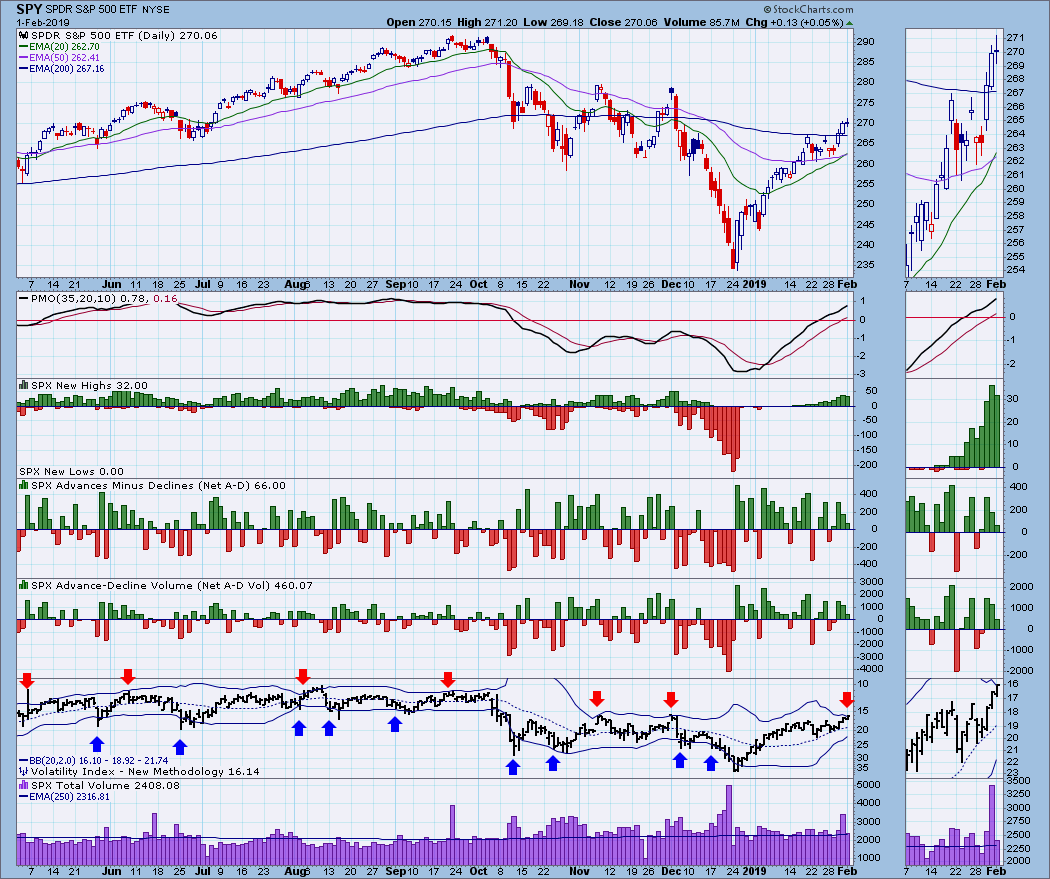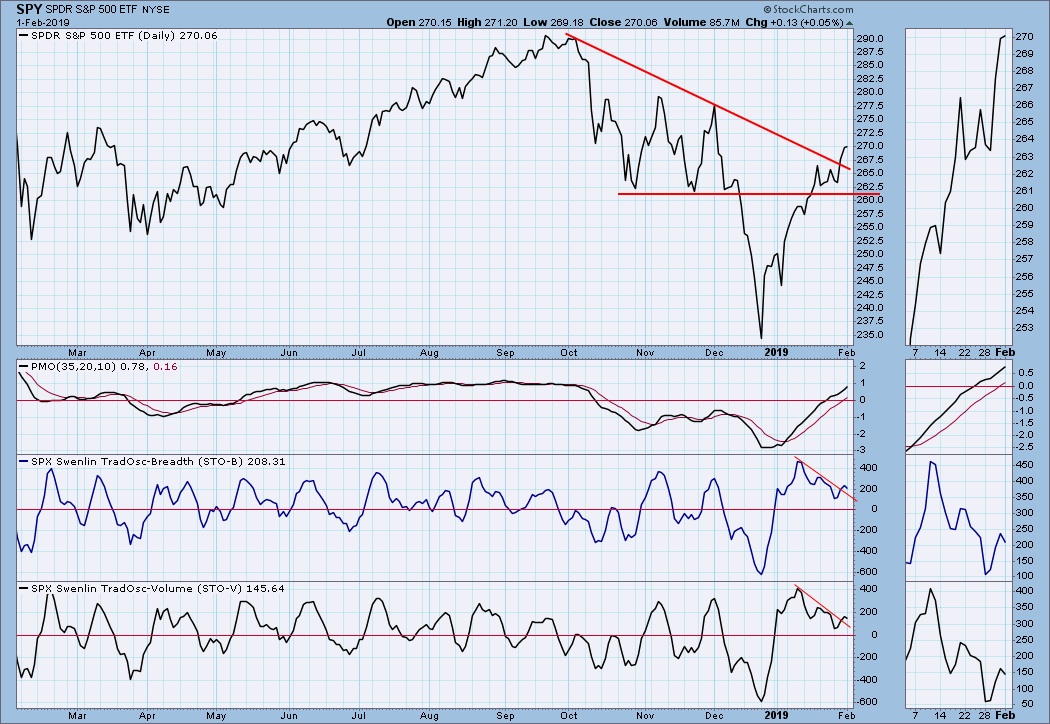
On Thursday, on expanding volume, SPY broke above the declining tops line drawn from the October Top, and at the same time it broke above the 200EMA. Then on Friday the SPY 20EMA crossed up through the 50EMA causing the IT Trend Model to change from NEUTRAL to a BUY signal. With this positive action, we should consider that the bull may have taken the helm, but there are some short-term caution signs.
The DecisionPoint Weekly Wrap presents an end-of-week assessment of the trend and condition of the stock market (S&P 500), the U.S. Dollar, Gold, Crude Oil, and Bonds.
Watch the latest episode of DecisionPoint on StockCharts TV's YouTube channel here!
SECTORS
Each S&P 500 Index component stock is assigned to one, and only one, of 11 major sectors. This is a snapshot of the Intermediate-Term and Long-Term Trend Model signal status for those sectors.
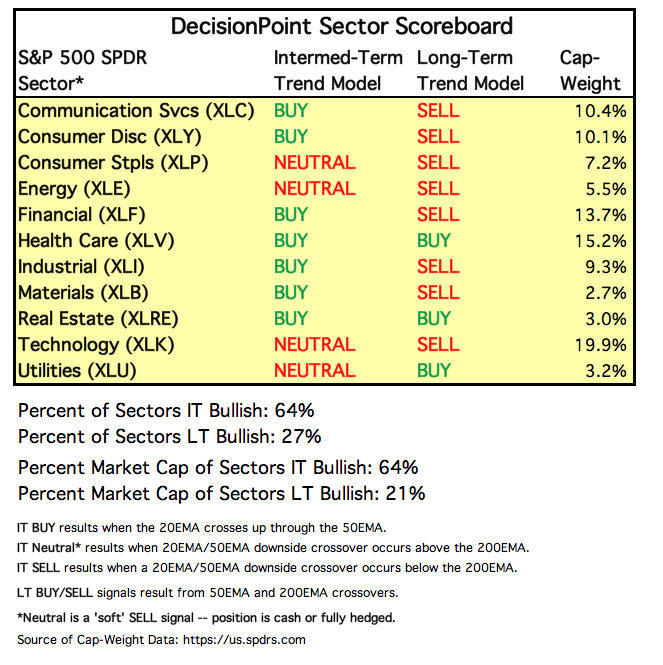 There were a total of five (5) new IT Trend Model BUY signals this week! XLF and XLB will probably switch to BUY next week.
STOCKS
IT Trend Model: BUY as of 2/1/2019
LT Trend Model: SELL as of 12/14/2018
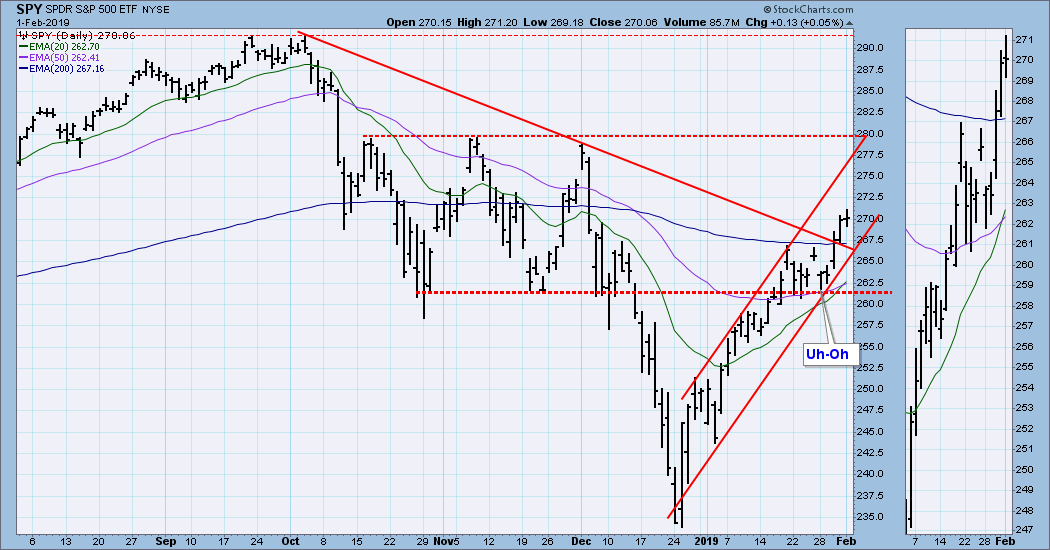
SPY Daily Chart: This week's price action deserves a closer look, thus the 6-month chart below. Last Friday price gapped up, but on Monday it gapped down and there was some heavy selling with the Dow being down over 400 points. A line of support was tested that day, and instead of breaking down, price closed near the top of the day's range, and my inner bear said to me, "Uh-Oh." It was a perfect place for the bear market to come roaring back, but it didn't, and I started preparing for some bullish action to follow. Which it did.
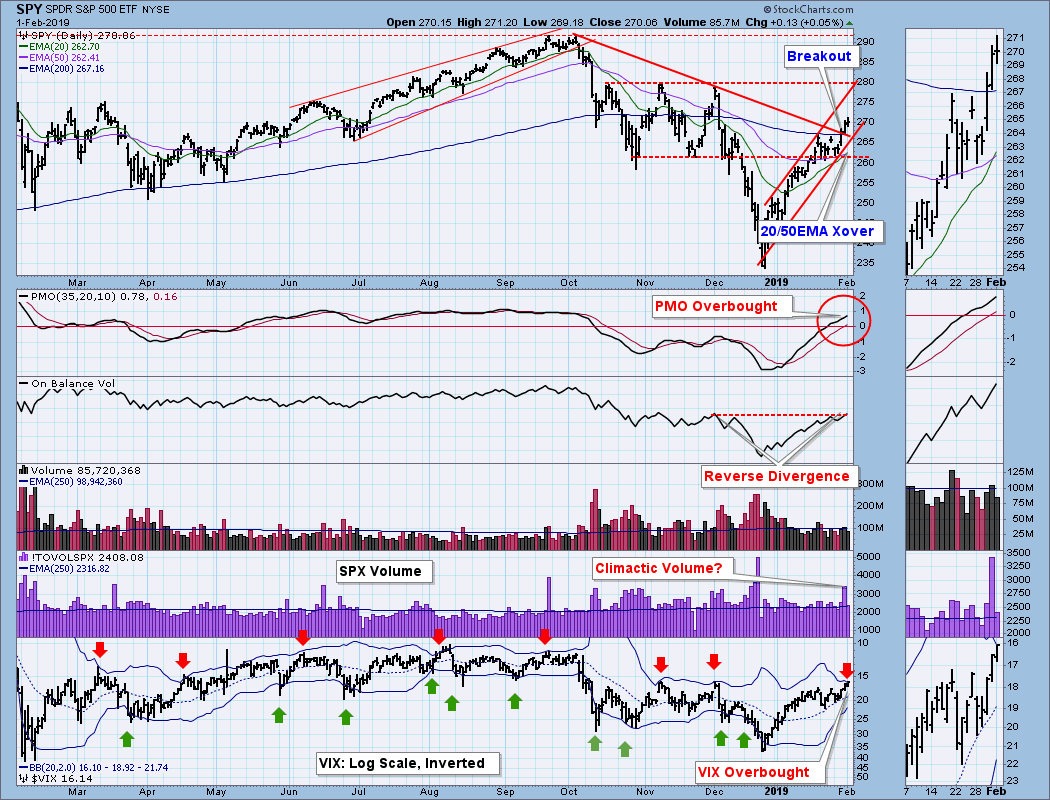
Despite the bullish breakout and ITTM BUY signal, there are some areas of concern to be considered on the daily chart below:
(1) The PMO is overbought, not painfully so but it is near the top of the one-year range.
(2) There is an OBV reverse divergence. While price is still well below the December top, OBV now equals the December OBV top. This is kind of a blowoff in that high volume does not have the traction to force price up a proportionate amount.
(3) S&P 500 volume on Thursday was possibly climactic, signifying a blowoff price top; however, it may instead be a positive sign of volume expanding on the breakout.
(4) Finally, the VIX panel shows that the VIX touched the top Bollinger Band, which frequently signals that a price top is close at hand.
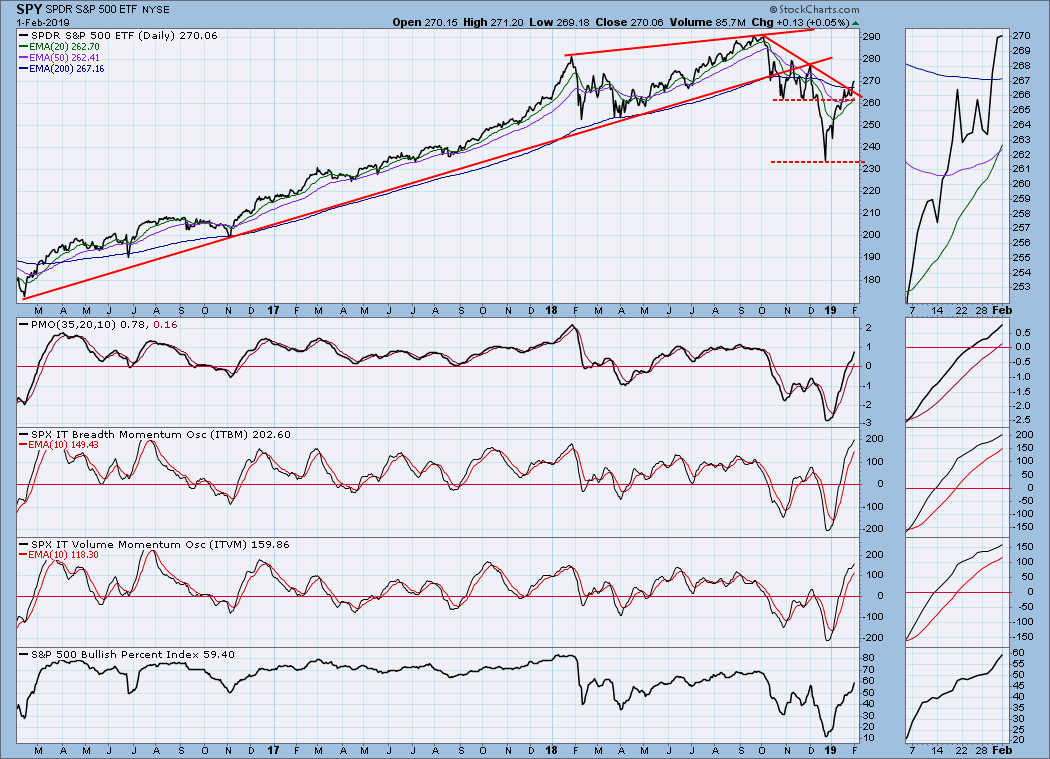
SPY Weekly Chart: SPY is still well below the bull market rising trend line, as well as the all-time high. The weekly PMO is rising.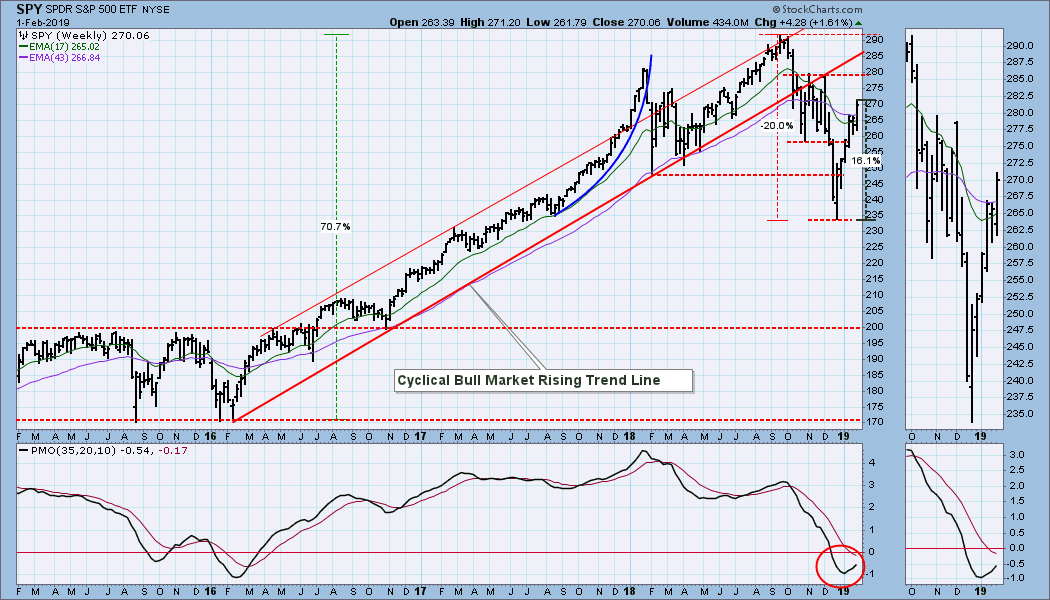
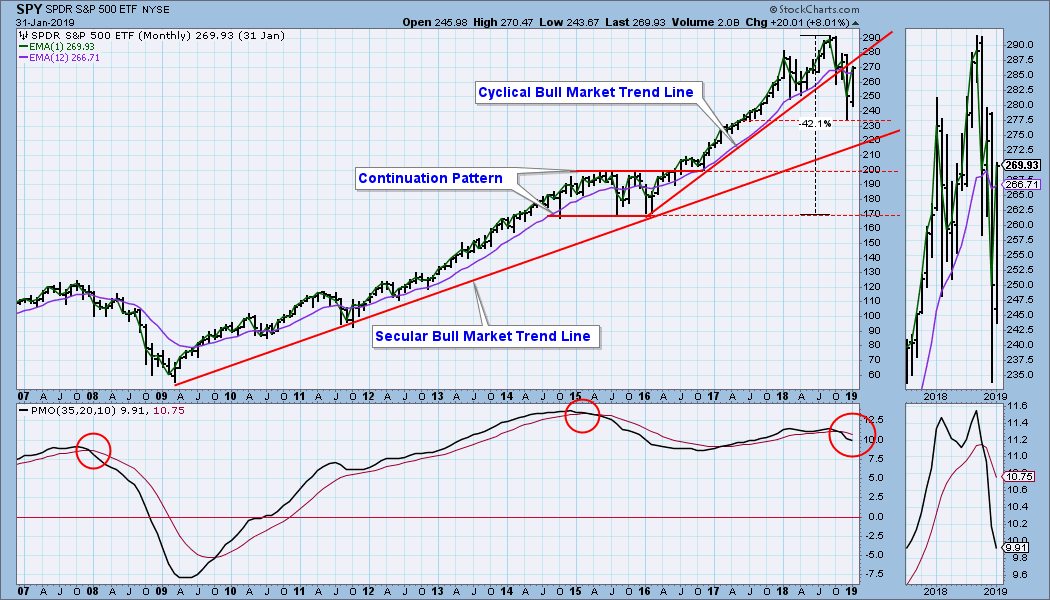
SPY Monthly Chart: Before we get too bullish, something we should still consider is that the SPY monthly PMO is still falling. For clarity, monthly charts in this issue are dated as of 1/31/19 (Thursday).
ULTRA-Short-Term Market Indicators: Net A-D and Net A-D Volume contracted Thursday and Friday.
Short-Term Market Indicators: The STO-B and STO-V broke out along with price.
Intermediate-Term Market Indicators: The ITBM and ITVM are both very overbought.
CONCLUSION: We got a new ITTM BUY signal for SPY, and nine of the 11 S&P 500 sectors are now on BUY signals, so the market picture is looking pretty bright. But let us remember, ITTM BUY signals are information flags, inviting us to take a closer look before we decide to act or not to act. Our closer look reveals that intermediate-term indicators are overbought, and a number of other indicators say that a pullback is likely next week. There is a good chance that the bear market ended at the end of December, but I would like to see how the market behaves during that pullback before I decide if that is the case. For one thing, the market has made no move toward a retest of the December lows. Maybe all we get this time around is a "V" bottom, but I hope we get more clarity next week. Actually, I really, really want that retest.
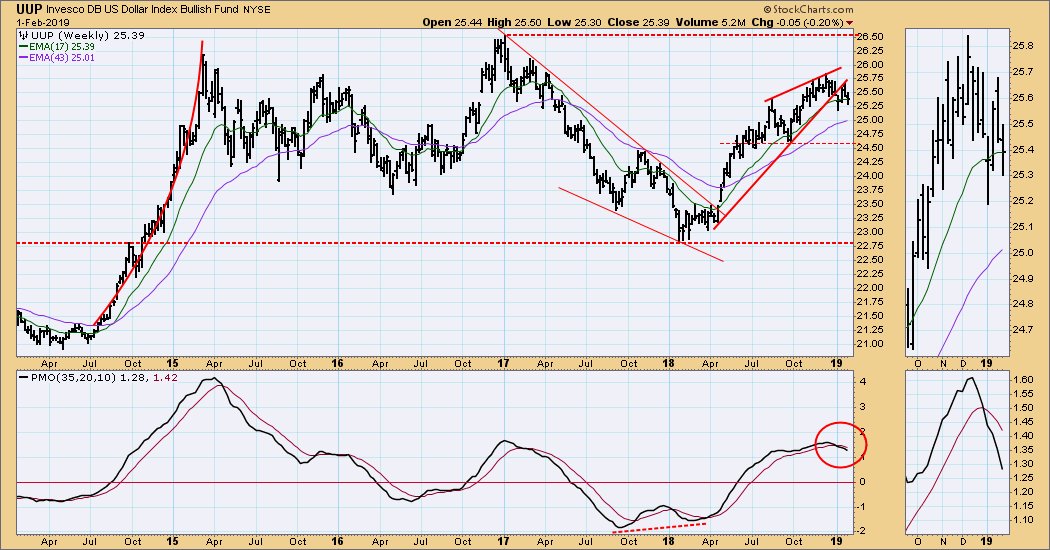
DOLLAR (UUP)
IT Trend Model: NEUTRAL as of 2/1/2019
LT Trend Model: BUY as of 5/25/2018
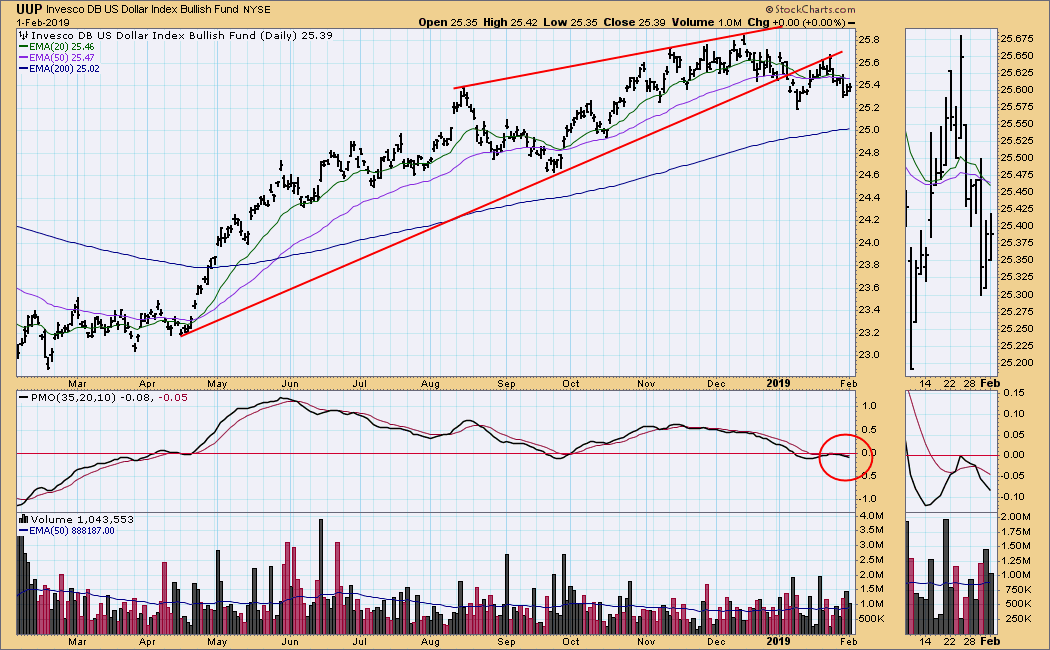
UUP Daily Chart: The dollar looks negative in all time frames. The UUP 20EMA crossed down through the 50EMA on Friday, and the IT Trend Model changed from BUY to NEUTRAL. The daily PMO is falling and is below the zero line and the signal line.
UUP Weekly Chart: The weekly PMO is below the signal line and falling.
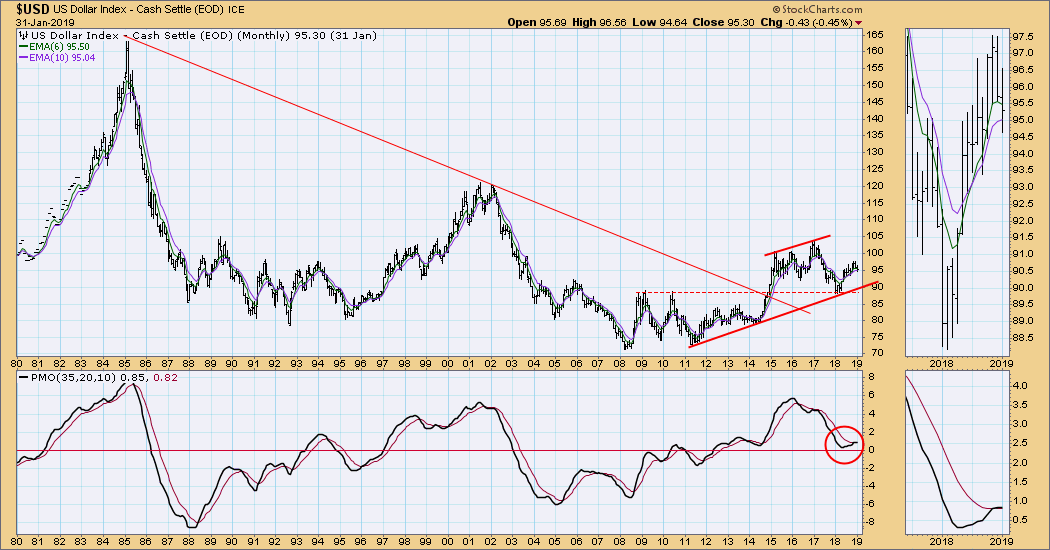
USD Monthly Chart: The monthly PMO is trying to top, signifying that the dollar is stalling in this time frame. For clarity, monthly charts in this issue are dated as of 1/31/19 (Thursday).
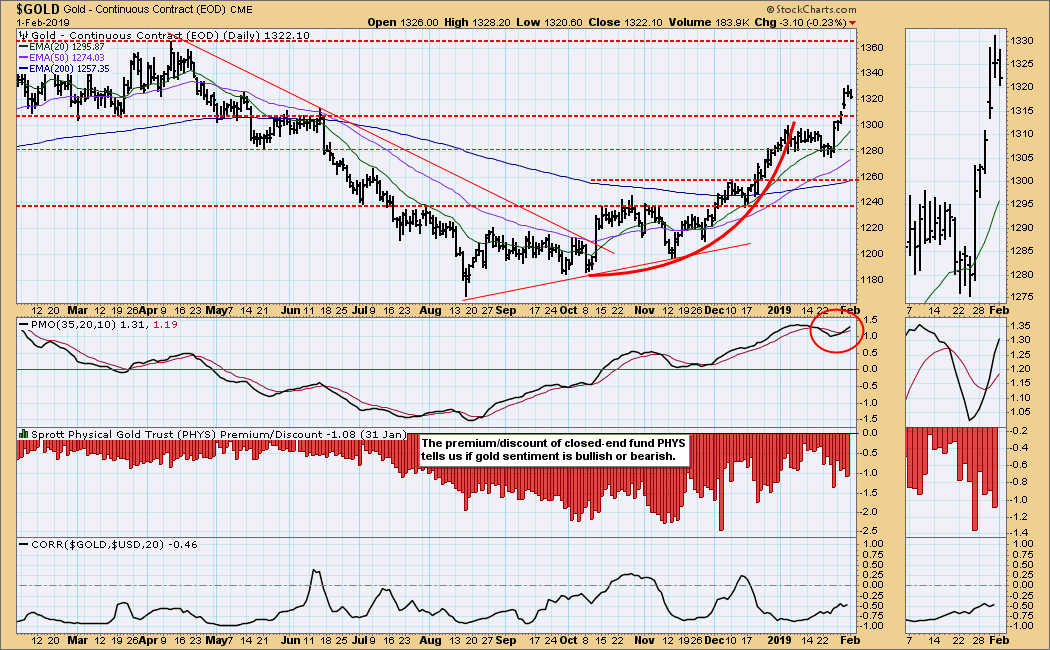
GOLD
IT Trend Model: BUY as of 10/19/2018
LT Trend Model: BUY as of 1/8/2019
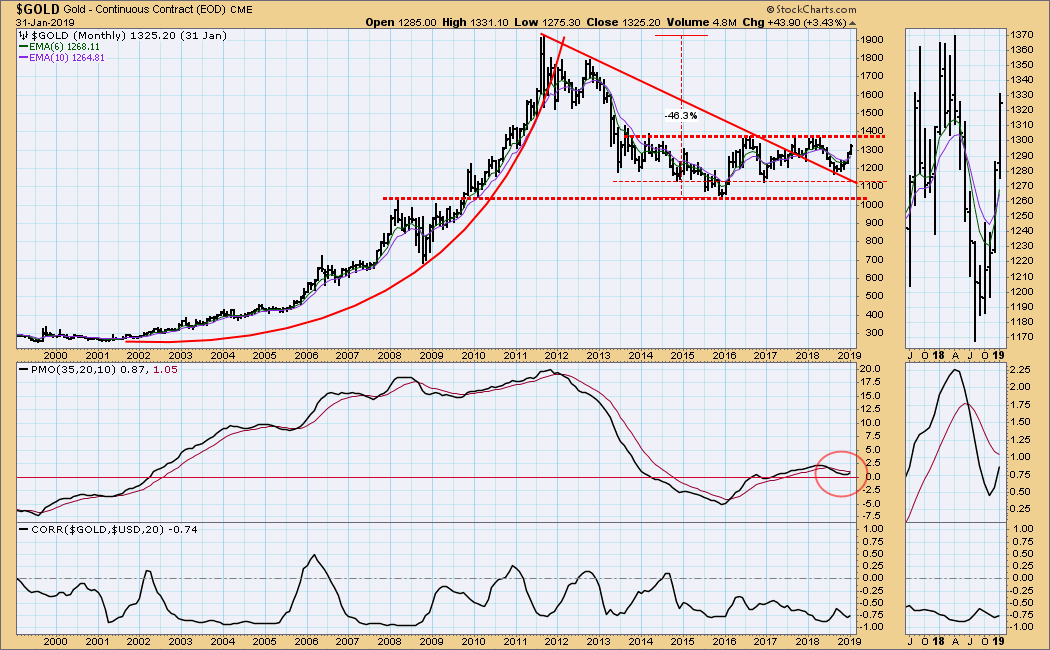
GOLD Daily Chart: Gold is looking very positive. It had a significant breakout this week, and the daily PMO is above the signal line and rising.
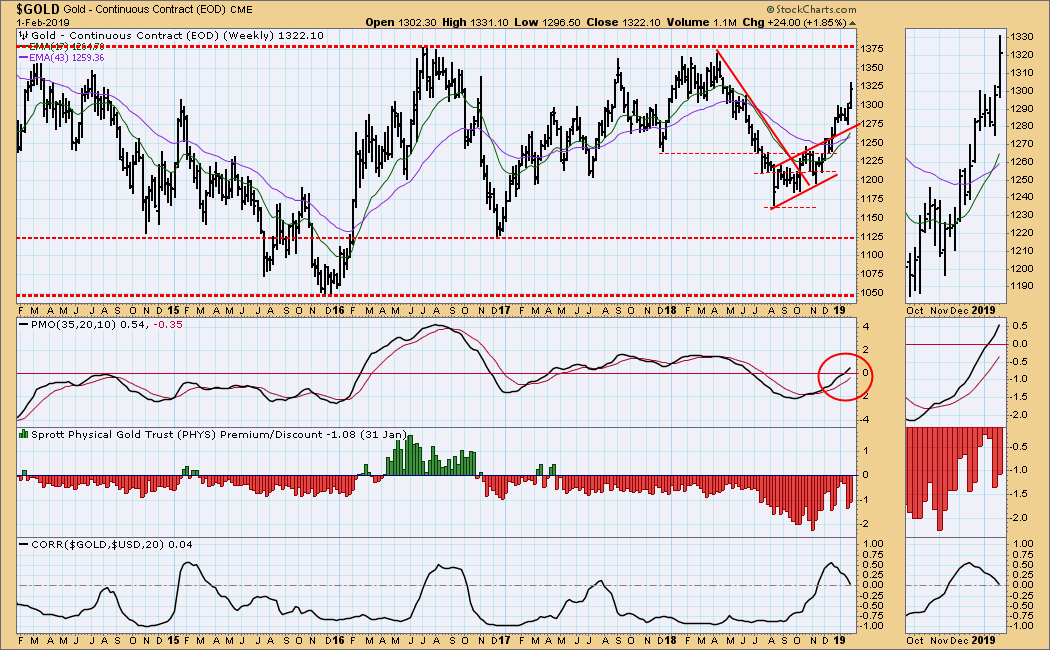
GOLD Weekly Chart: The weekly PMO is rising and is above the signal line and zero line.
GOLD Monthly Chart: The monthly PMO is above the zero line and rising. It appears that price could be testing the top of the five-year trading range in a month or two. For clarity, monthly charts in this issue are dated as of 1/31/19 (Thursday).
CRUDE OIL (USO)
IT Trend Model: NEUTRAL as of 10/29/2018
LT Trend Model: SELL as of 11/23/2018
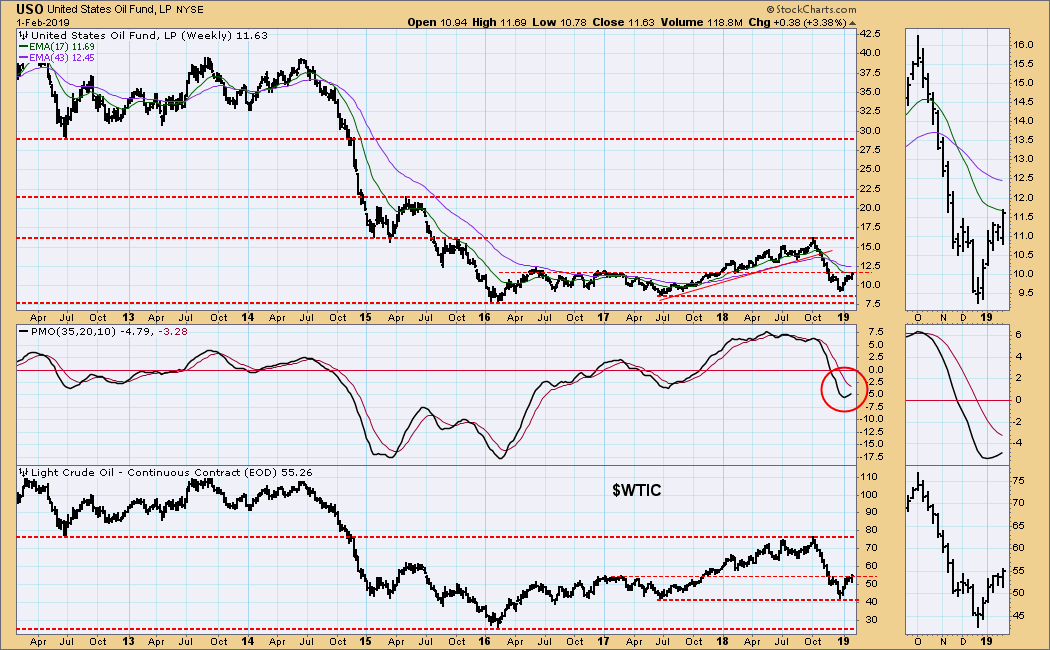
USO Daily Chart: The rising flag is mostly intact, except for the "outlier" down tick on Monday. I continue to think that this is a weak formation, although I don't anticipate a major reversal.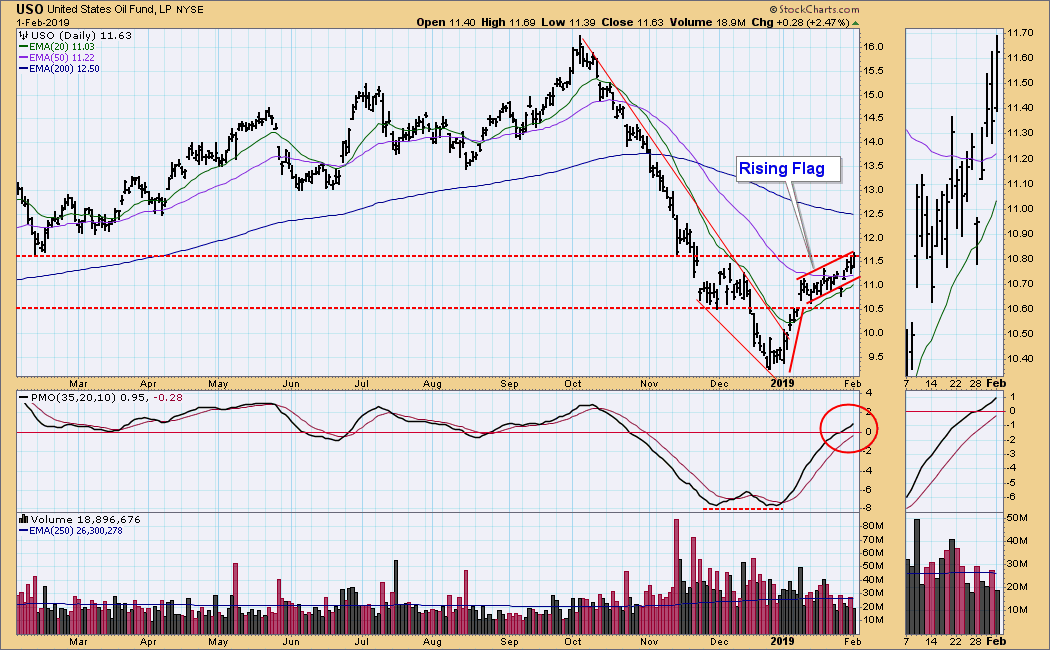 USO Weekly Chart: Reverse head and shoulders formations, as well as a rising weekly PMO paint a positive picture for crude.
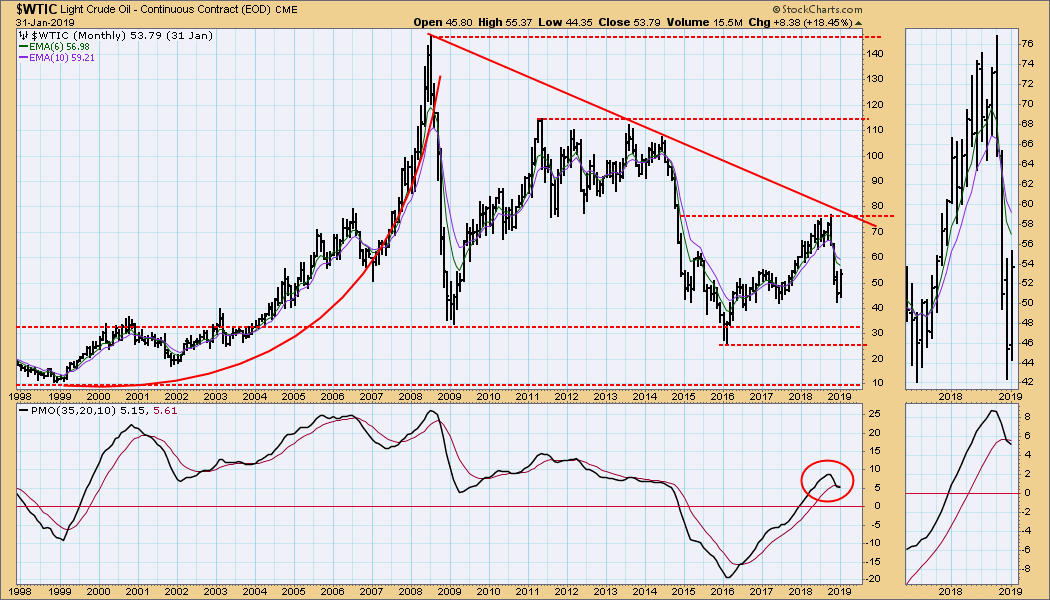
WTIC Monthly Chart: The correction in crude may be over, but it would be nice to see the monthly PMO turn up. For clarity, monthly charts in this issue are dated as of 1/31/19 (Thursday).
BONDS (TLT)
IT Trend Model: BUY as of 12/6/2018
LT Trend Model: BUY as of 1/2/2019
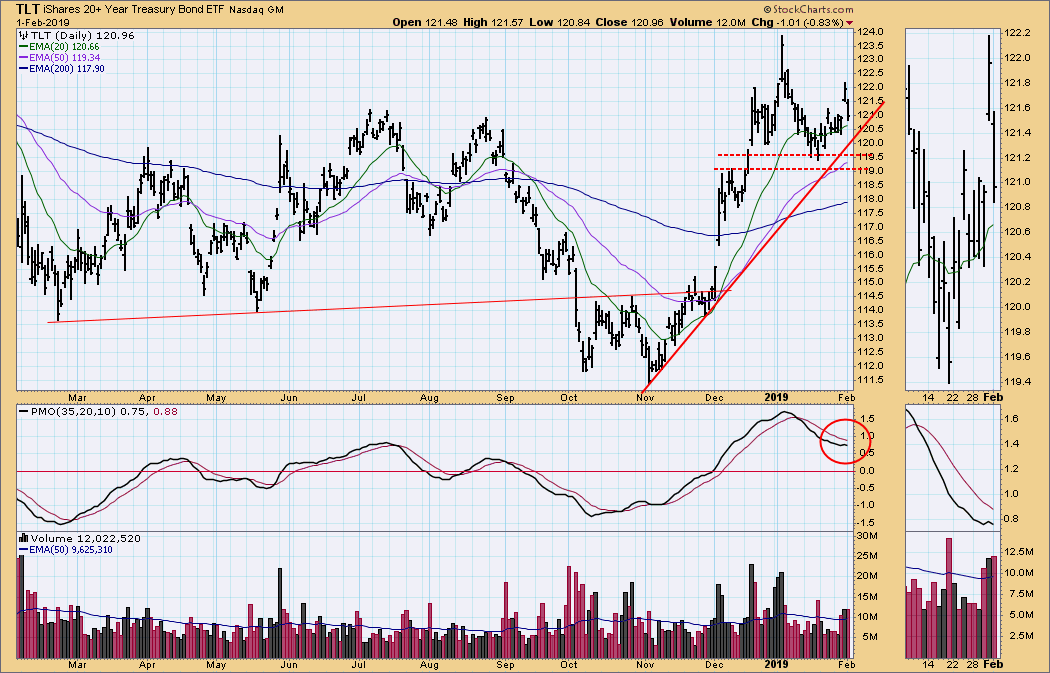
TLT Daily Chart: There was some confusing chop at the end of the week, and the daily PMO turned up on Thursday only to turn back down on Friday.
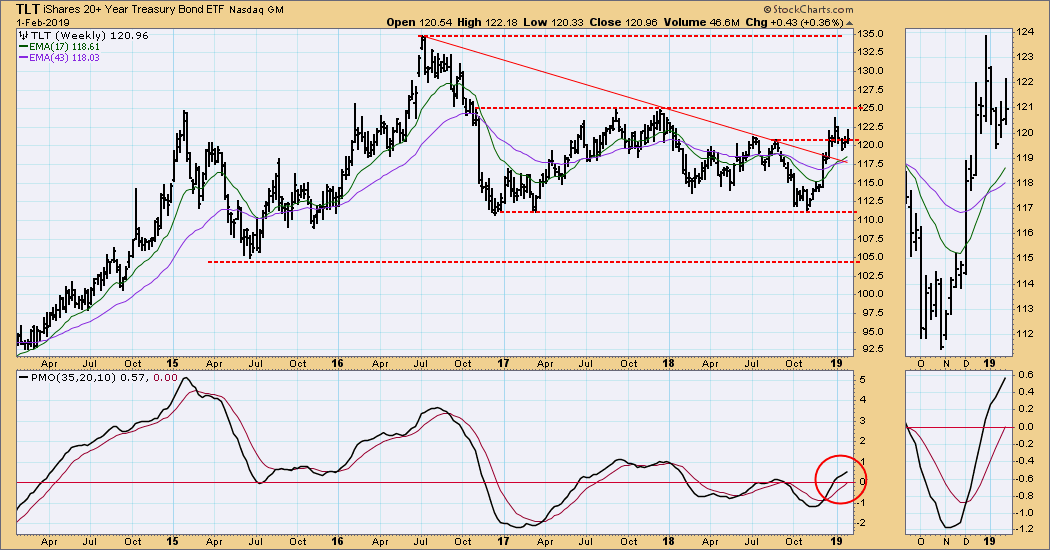
TLT Weekly Chart: Price seems to have stalled below the top of the two-year trading range, but the weekly PMO is still rising.
USB Monthly Chart: Bonds have bounced off the 30-year rising trend line, stopping a two-year slide by breaking above the declining tops line. The monthly PMO is rising. For clarity, monthly charts in this issue are dated as of 1/31/19 (Thursday).
**Don't miss any of the DecisionPoint commentaries! Go to the "Notify Me" box toward the end of this blog page to be notified as soon as they are published.**
Technical Analysis is a windsock, not a crystal ball.
Happy Charting!
- Carl
NOTE: The signal status reported herein is based upon mechanical trading model signals, specifically, the DecisionPoint Trend Model. They define the implied bias of the price index based upon moving average relationships, but they do not necessarily call for a specific action. They are information flags that should prompt chart review. Further, they do not call for continuous buying or selling during the life of the signal. For example, a BUY signal will probably (but not necessarily) return the best results if action is taken soon after the signal is generated. Additional opportunities for buying may be found as price zigzags higher, but the trader must look for optimum entry points. Conversely, exit points to preserve gains (or minimize losses) may be evident before the model mechanically closes the signal.
Helpful DecisionPoint Links:
DecisionPoint Shared ChartList and DecisionPoint Chart Gallery
Price Momentum Oscillator (PMO)
Swenlin Trading Oscillators (STO-B and STO-V)

