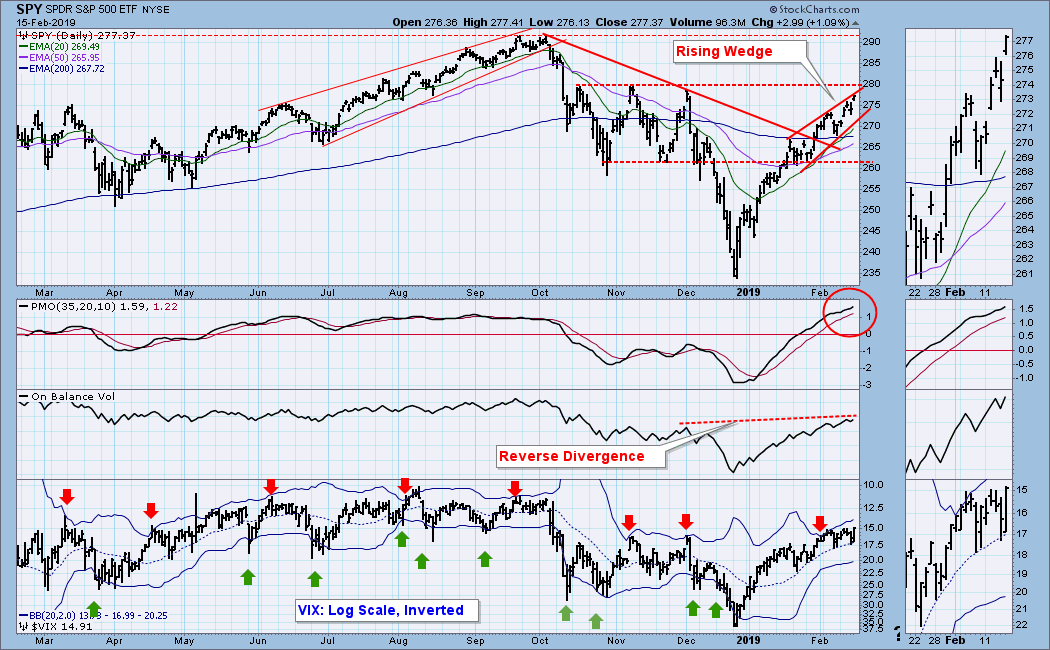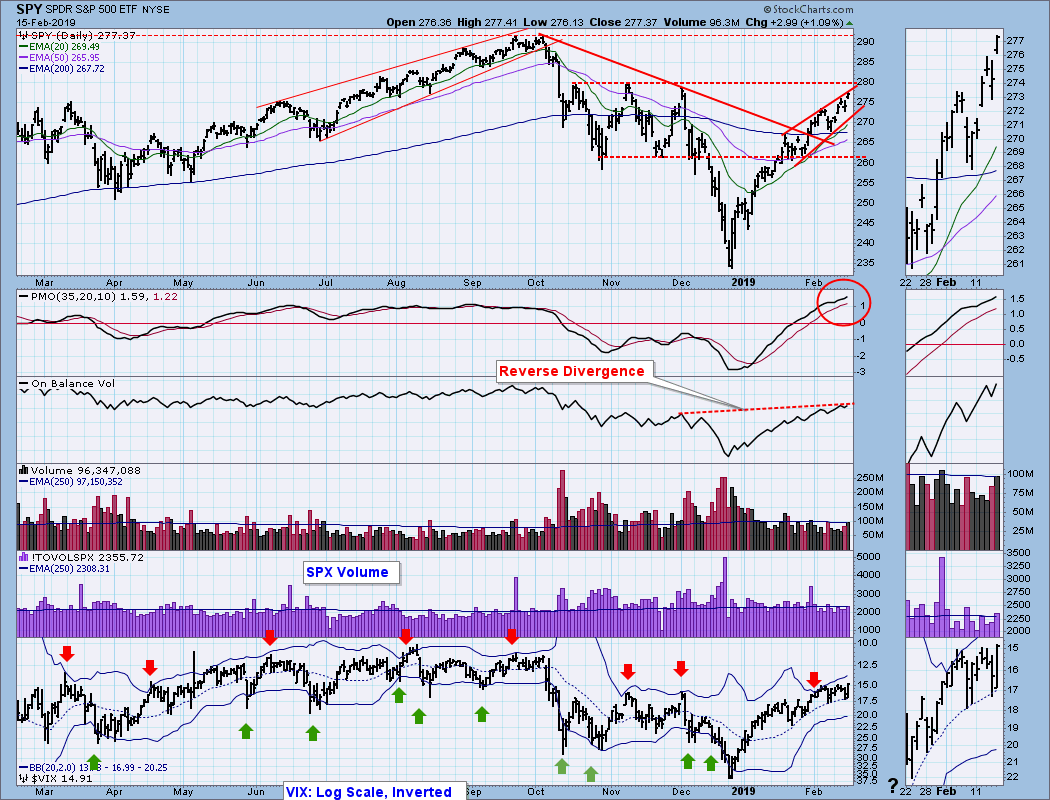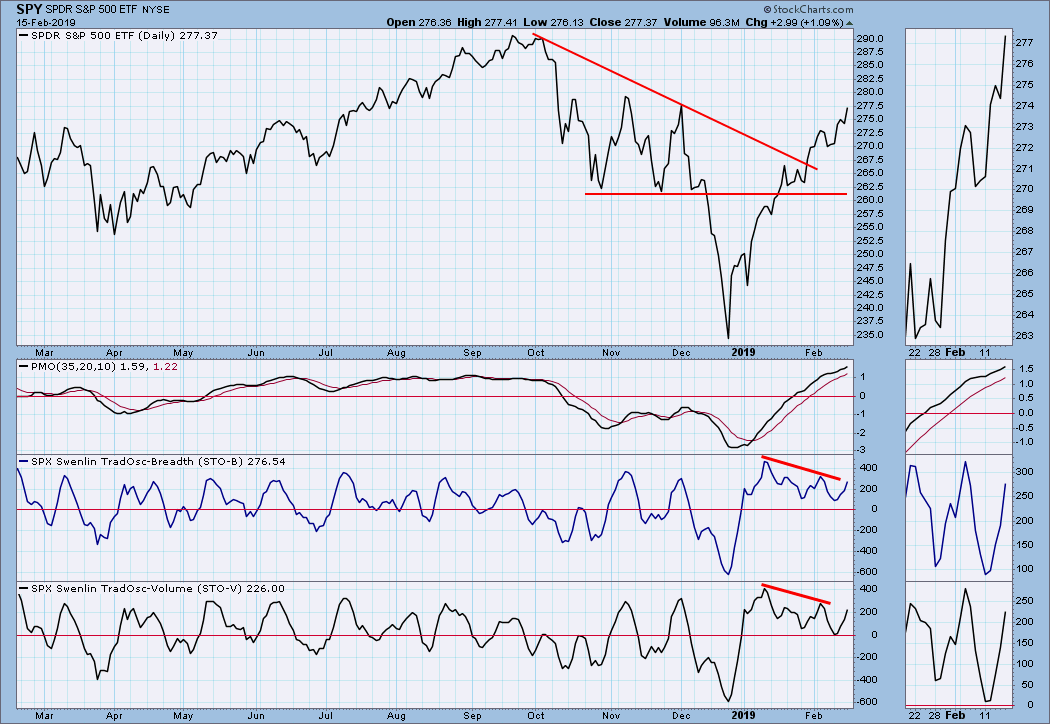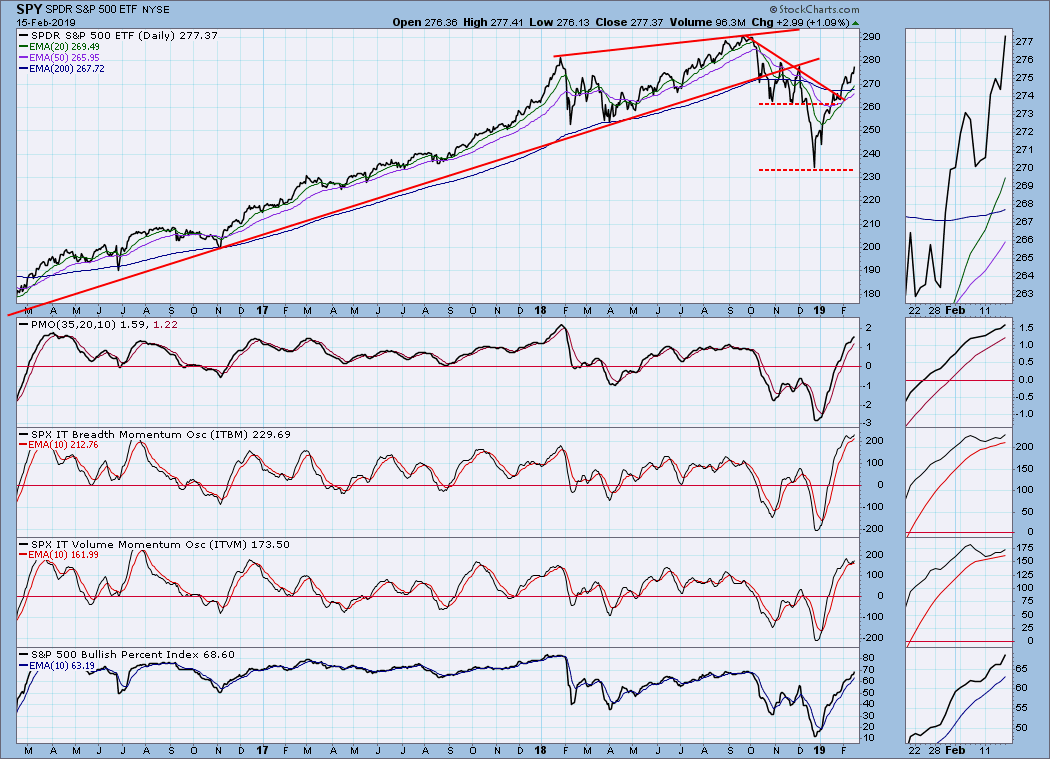
There are some indicators that have been warning of a price top for a couple of weeks, but the market just keeps powering upward. (1) There is an OBV reverse divergence, where the OBV has exceeded its December top well ahead of price. This means that heavy volume hasn't been able to bring price along with it. (2) Price has formed a rising wedge, which we normally expect to break down. (3) The VIX hit the upper Bollinger Band at the beginning of this month, which is frequently a top signal. The fact that the market has been ignoring these negative signs is bullish, but the situation does make me nervous. Finally, the daily PMO is at its most overbought level in a year. When it tops, that should be a good short-term sell signal.
The DecisionPoint Weekly Wrap presents an end-of-week assessment of the trend and condition of the stock market (S&P 500), the U.S. Dollar, Gold, Crude Oil, and Bonds.
Watch the latest episode of DecisionPoint on StockCharts TV's YouTube channel here!
SECTORS
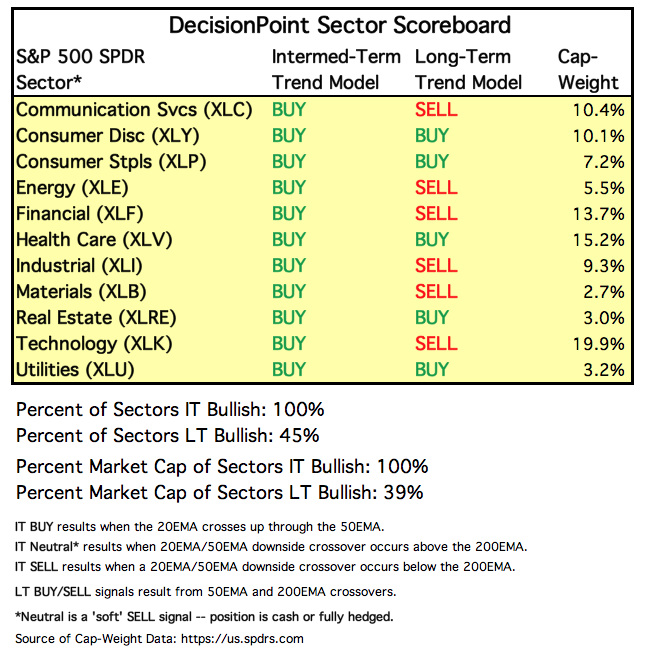
Each S&P 500 Index component stock is assigned to one, and only one, of 11 major sectors. This is a snapshot of the Intermediate-Term and Long-Term Trend Model signal status for those sectors.
STOCKS
IT Trend Model: BUY as of 2/1/2019
LT Trend Model: SELL as of 12/14/2018
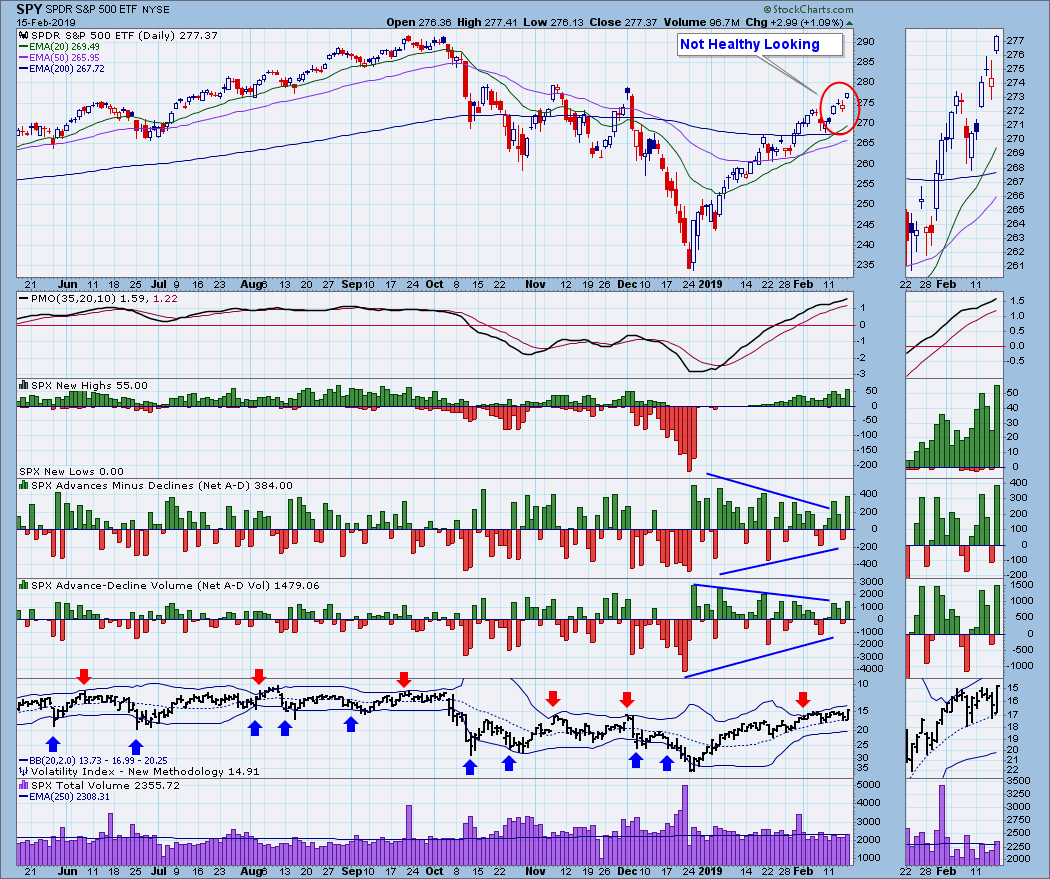
SPY Daily Chart: Friday was options expiration. I normally expect relatively quiet trading, but the market made good gains. Friday's advance was made on solid volume, but volume may have been juiced by options expiration, leaving volume minus options rollovers a bit thin.
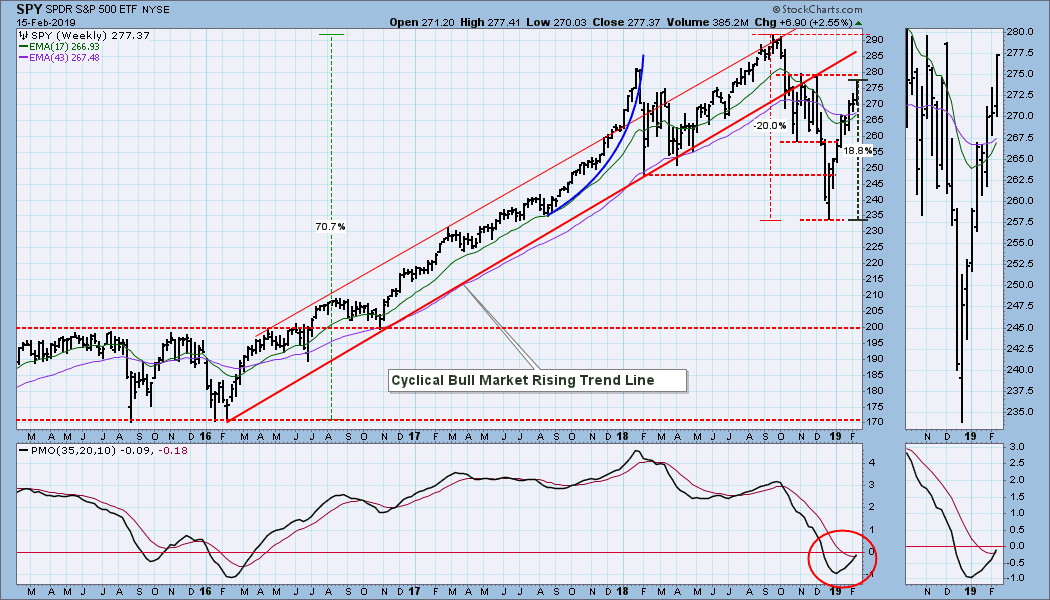
SPY Weekly Chart: We got a new weekly PMO crossover BUY signal, and it looks solid.
Climactic Market Indicators: Erin and I talked on the DecisionPoint show about these indicators. At first blush I thought that the spikes on the New Highs, Net A-D, and Net A-D Volume might have been an initiation climax. Now, after having time for leisurely perusal, I noticed the choppy appearance of the candlesticks, which, as the chart note says, doesn't look healthy to me. I can't quote chapter and verse, it just doesn't look solid.
Short-Term Market Indicators: These indicators have been above the zero line since the first push off the December bottom.
Intermediate-Term Market Indicators: The ITBM and ITVM are very overbought. The BPI is strong at 69, but I have been manually tracking the percent of IT Trend Model BUY signals on S&P 500 component stocks. It is 79, and that is getting into the "as good as it's going to get" zone.
CONCLUSION: The market has been irrepressible -- it starts selling but recovers by the end of the day, etc. But it is super-extended and intermediate-term indicators are very overbought. This doesn't mean a big selloff is bound to happen, but surely some kind of corrective action will take place and soon. If I was inclined to kick back and enjoy the bullish action, the candlestick pattern for this week that I mentioned above undermined that inclination. I'll relax later.
Note: The market will be closed on Monday for the Presidents Day holiday.
DOLLAR (UUP)
IT Trend Model: BUY as of 2/7/2019
LT Trend Model: BUY as of 5/25/2018
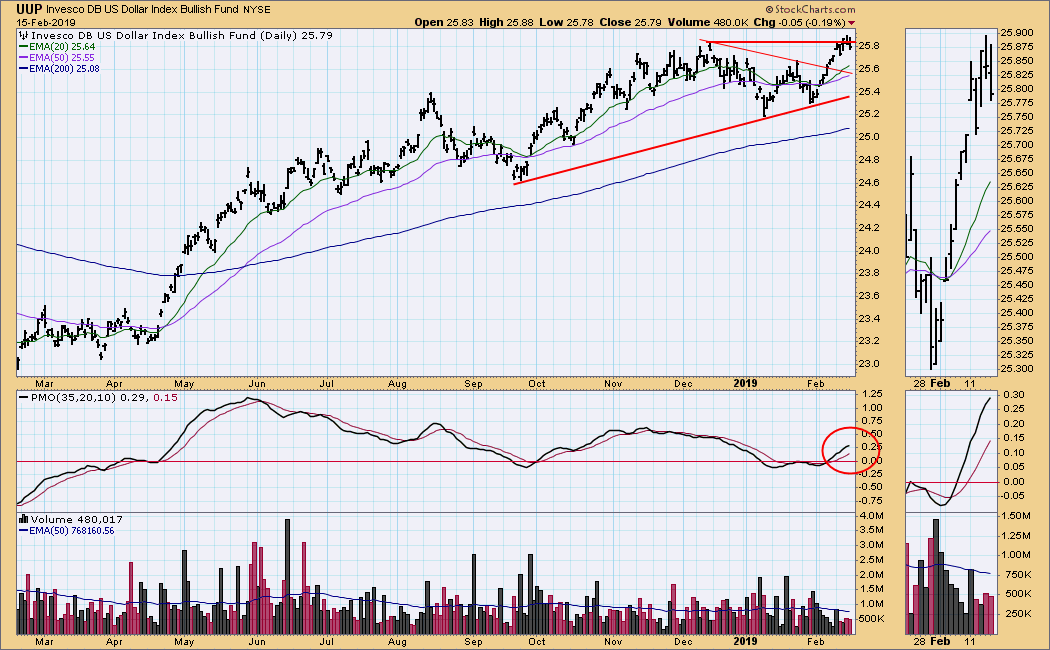
UUP Daily Chart: Price broke out of a symmetrical triangle last week, and it is now testing the resistance at the top of an ascending triangle. The daily PMO is positive.
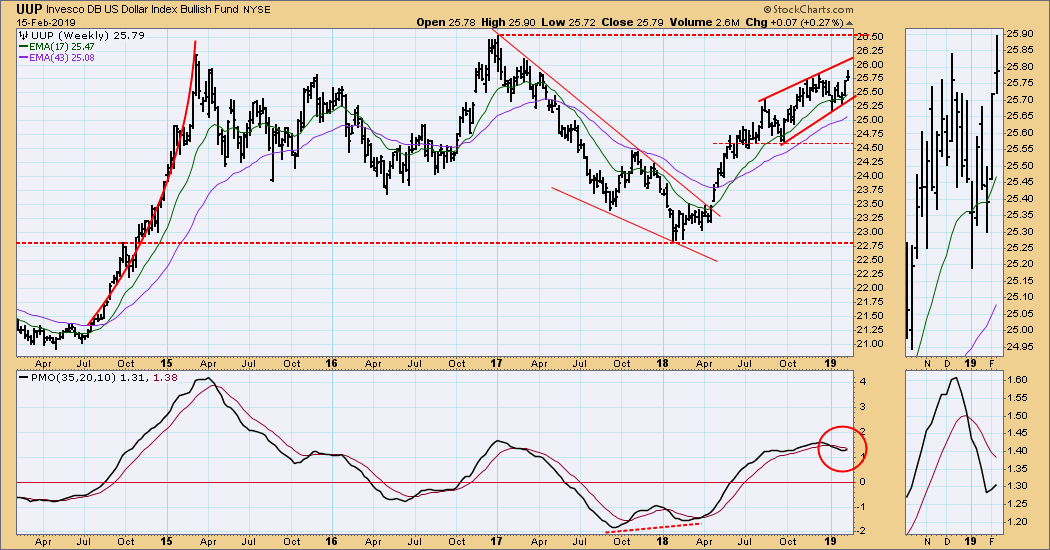
UUP Weekly Chart: UUP is currently in a rising wedge formation, although it is not a very tight one. This week's price action implies that price may be about to reverse and head to the bottom of the wedge. In the broader picture UUP is near the top of a four-year trading range.
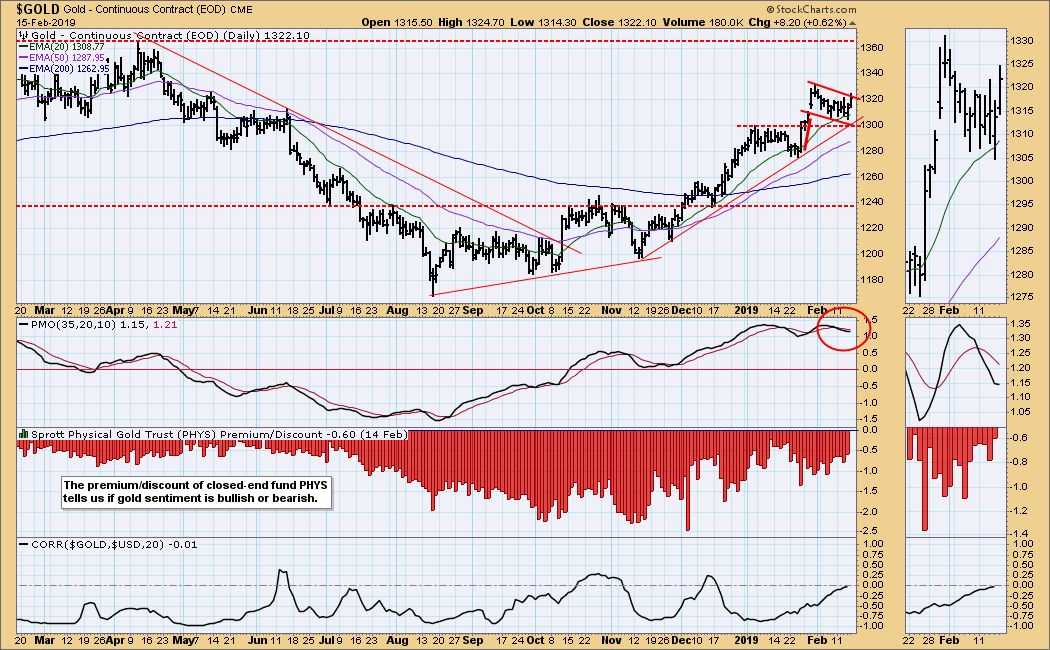
GOLD
IT Trend Model: BUY as of 10/19/2018
LT Trend Model: BUY as of 1/8/2019
GOLD Daily Chart: The falling flag formation is bullish -- we assume that the pullback is building compression to fuel another up leg. There is a negative divergence on the daily PMO, but gold is currently in a bull market (the 50EMA is above the 200EMA), so the negative divergence carries less weight.
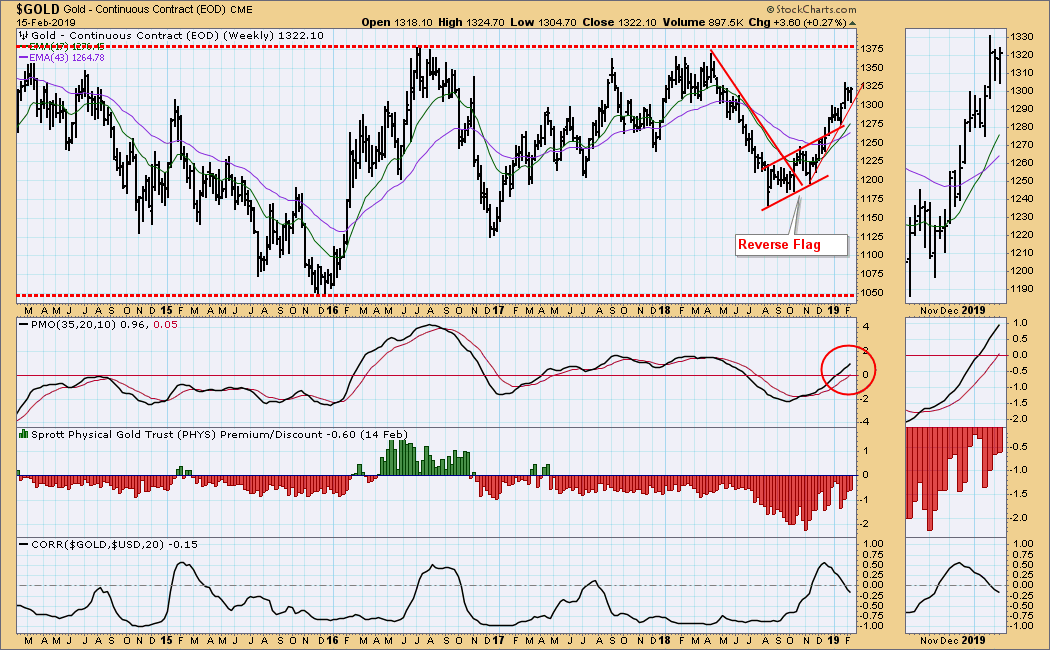
GOLD Weekly Chart: Near the end of last year gold broke out of a bearish reverse flag formation, a bullish move. It is now headed for the top of the long-term trading range.
CRUDE OIL (USO)
IT Trend Model: NEUTRAL as of 10/29/2018
LT Trend Model: SELL as of 11/23/2018
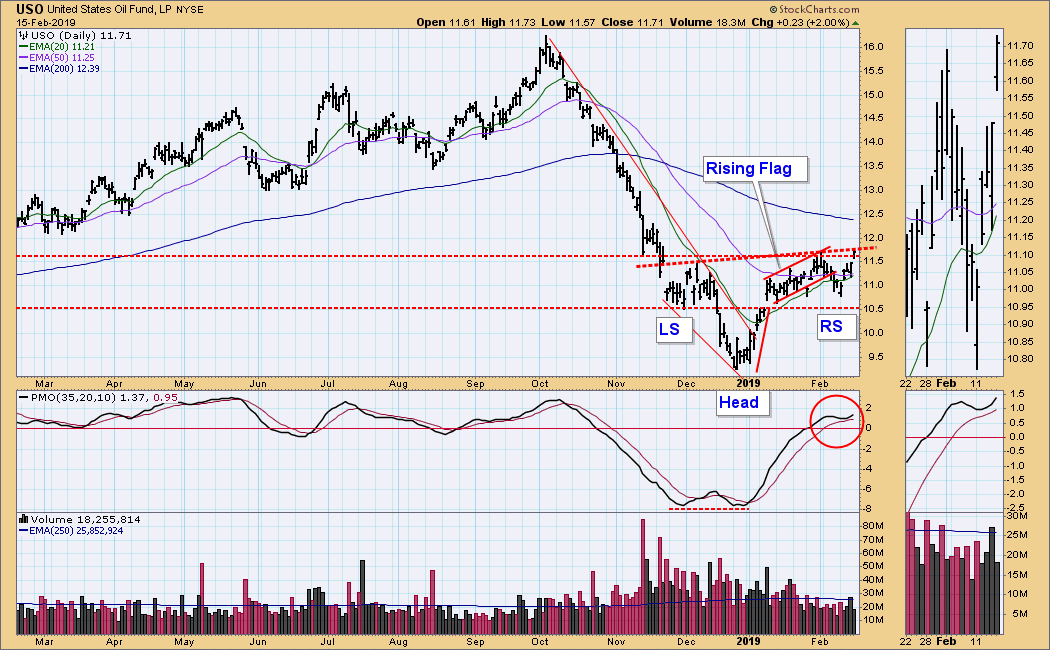
USO Daily Chart: When I first identified the rising flag formation, I pointed out that it is typically a weak formation. We can see that it resolved downward, and a new short-term rising trend has begun. The daily PMO has turned up above the signal line. There is also a reverse head and shoulders pattern, and price is challenging the neckline.
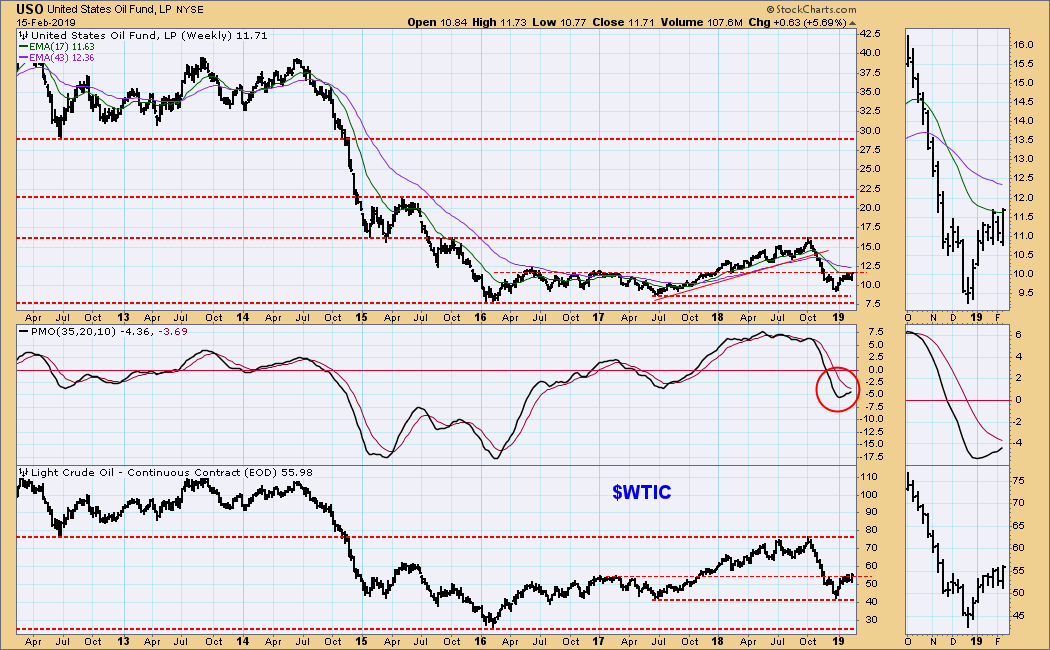
USO Weekly Chart: The weekly PMO has bottomed, but it is below the signal line and moving up at a slow pace. This is not an inspiring configuration. Note that crude is trading around 55, and the WTIC reverse head and shoulders neckline falls on a longer-term line of resistance.
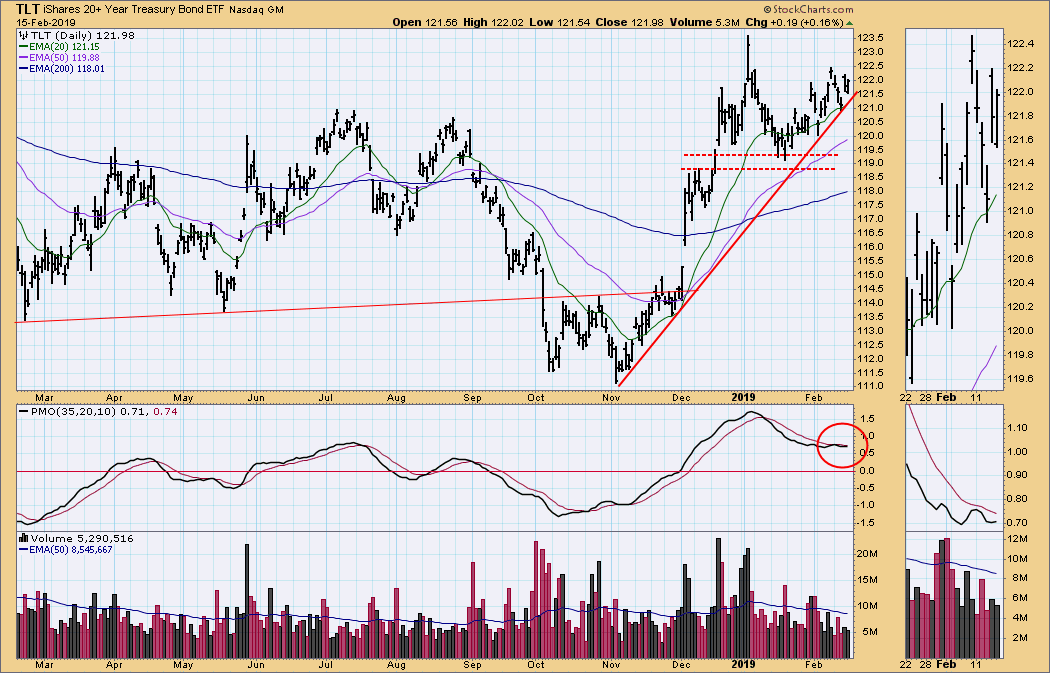
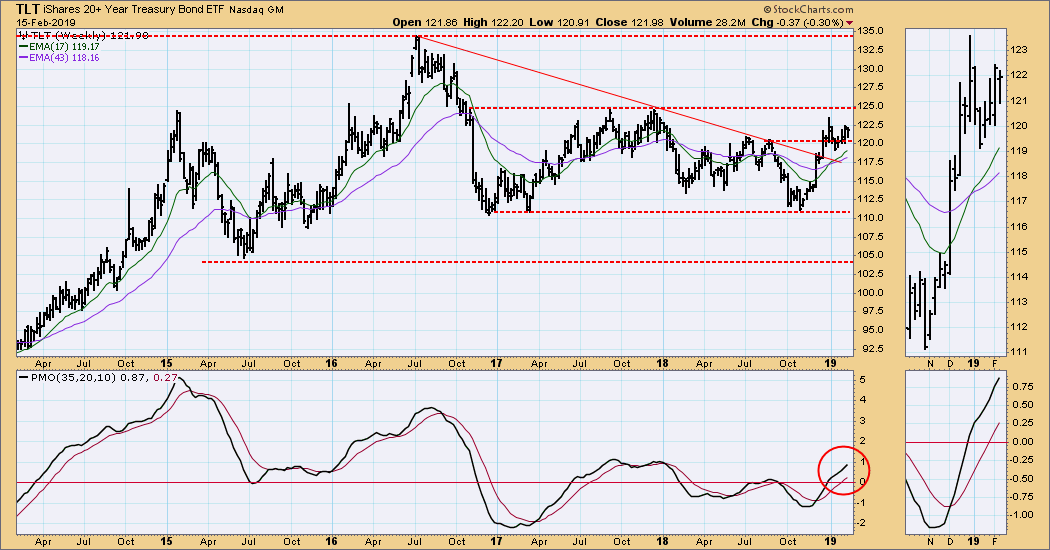
BONDS (TLT)
IT Trend Model: BUY as of 12/6/2018
LT Trend Model: BUY as of 1/2/2019
TLT Daily Chart: The daily PMO is positive, and a rising trend line seems to be guiding price higher.
TLT Weekly Chart: We can see where TLT broke above a declining tops line last year, but the dominant feature is the trading range that has contained price for over two years. The weekly PMO is positive, but nearing the top of it's two-year range.
**Don't miss any of the DecisionPoint commentaries! Go to the "Notify Me" box toward the end of this blog page to be notified as soon as they are published.**
Technical Analysis is a windsock, not a crystal ball.
Happy Charting!
- Carl
NOTE: The signal status reported herein is based upon mechanical trading model signals, specifically, the DecisionPoint Trend Model. They define the implied bias of the price index based upon moving average relationships, but they do not necessarily call for a specific action. They are information flags that should prompt chart review. Further, they do not call for continuous buying or selling during the life of the signal. For example, a BUY signal will probably (but not necessarily) return the best results if action is taken soon after the signal is generated. Additional opportunities for buying may be found as price zigzags higher, but the trader must look for optimum entry points. Conversely, exit points to preserve gains (or minimize losses) may be evident before the model mechanically closes the signal.
Helpful DecisionPoint Links:
DecisionPoint Shared ChartList and DecisionPoint Chart Gallery
Price Momentum Oscillator (PMO)
Swenlin Trading Oscillators (STO-B and STO-V)

