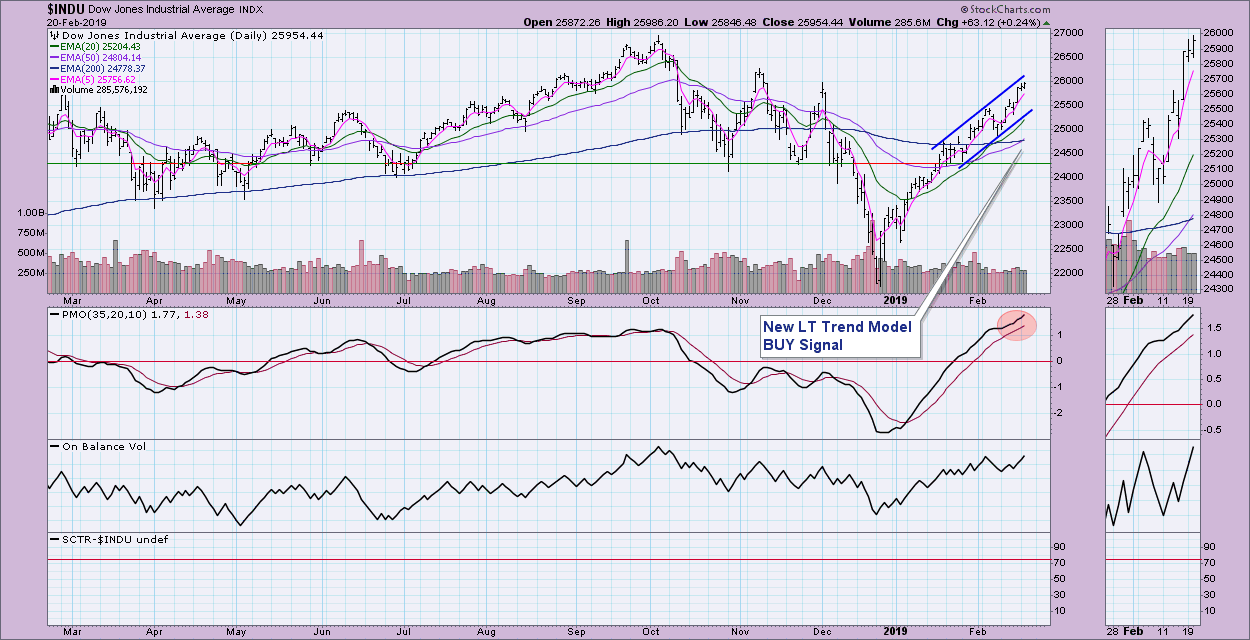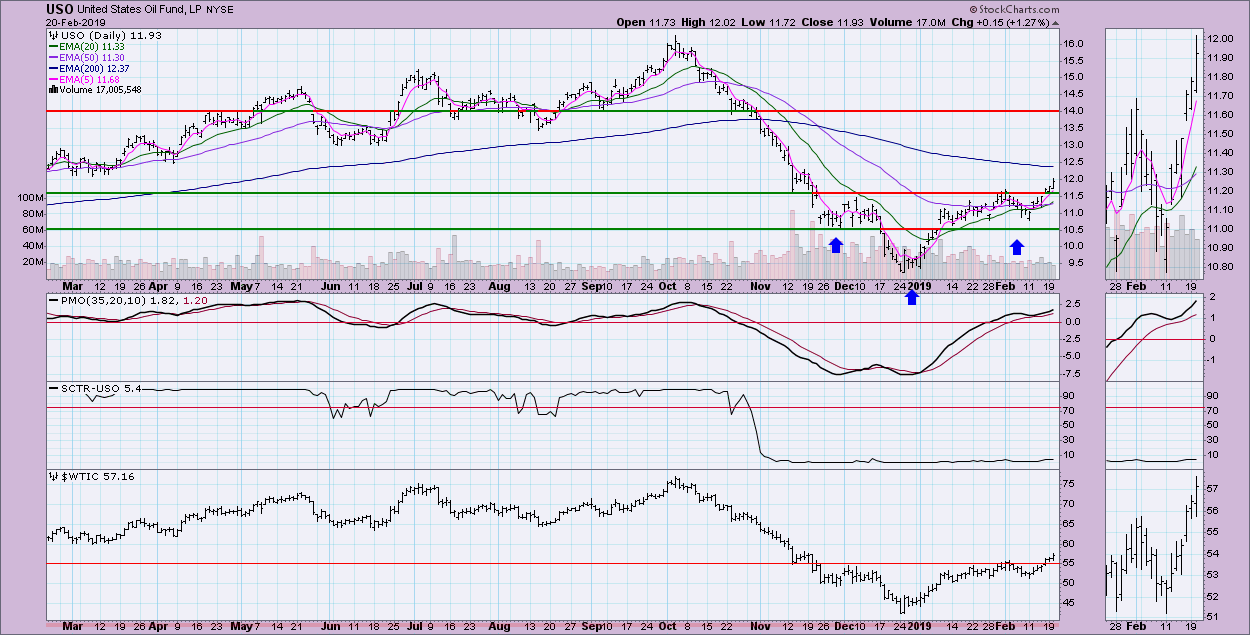
 Today, we had two important signal changes. First, on the Dow Industrials, a LT Trend Model BUY signal triggered as the 50-EMA crossed above the 200-EMA. Second, USO generated an IT Trend Model BUY signal.
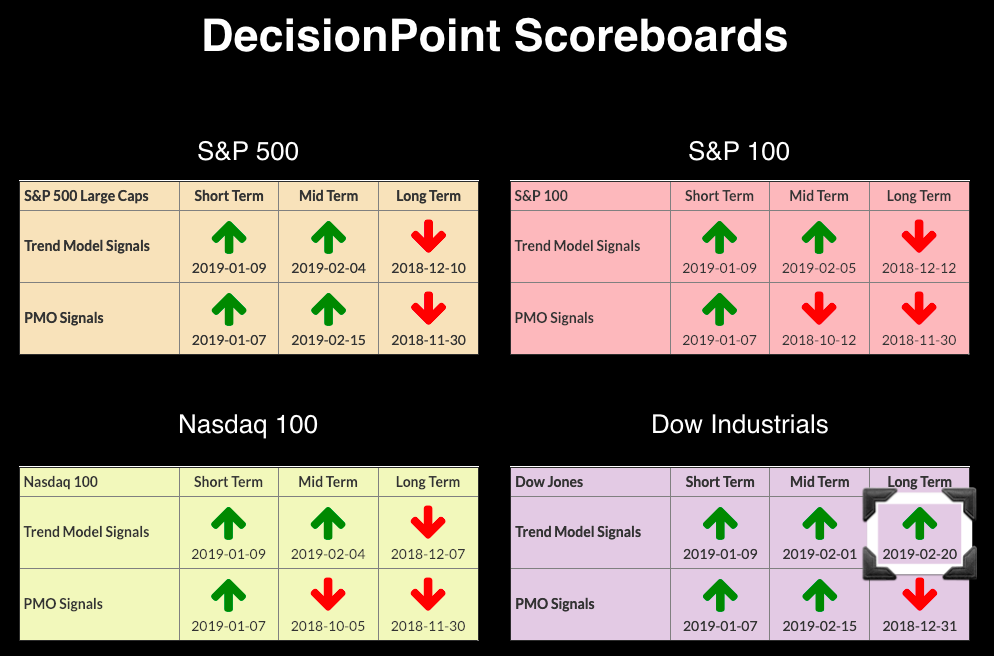
I imagine the first question that will be asked about this new LT BUY signal is whether this is the end of the bear market. This is certainly good news for bulls, but indicators are very overbought and you can see that OBV tops are about even with each other while price tops are steeply rising.
The DecisionPoint Alert presents a mid-week assessment of the trend and condition of the stock market (S&P 500), the U.S. Dollar, Gold, Crude Oil and Bonds.
Watch the latest episode of DecisionPoint on StockCharts TV's YouTube channel here!
SECTORS
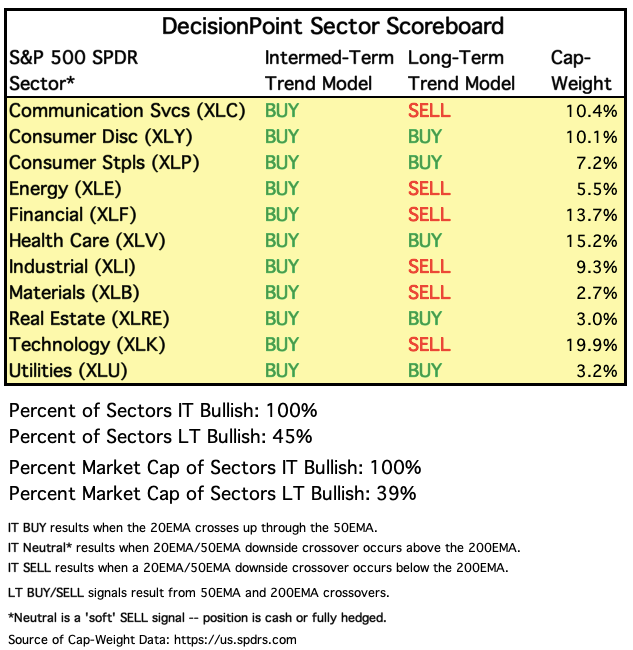
Note that we now have all BUY signals in the intermediate term. The only LT BUY signals are on the defensive sectors, XLP, XLU, XLV and XLRE. Last week, however, we did add the LT BUY signal on the more aggressive Consumer Discretionary (XLY) sector. Typically, I would look at a Scoreboard like this and say that the market is coming out the darkness and into the light. I do see this Scoreboard as a positive for the market, but everything appears so overbought that I can't completely move to the side of the bulls.
Each S&P 500 Index component stock is assigned to one (and only one) of eleven major sectors. This is a snapshot of the Intermediate-Term and Long-Term Trend Model signal status for those sectors.
STOCKS
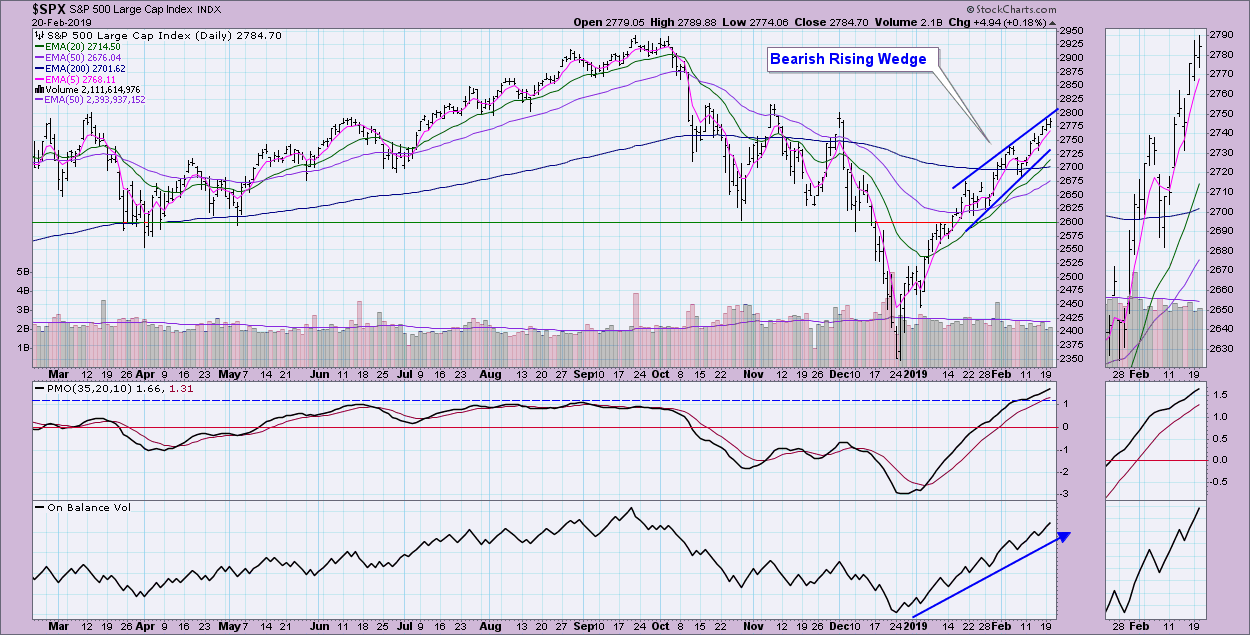
IT Trend Model: BUY as of 2/1/2019
LT Trend Model: SELL as of 12/14/2018
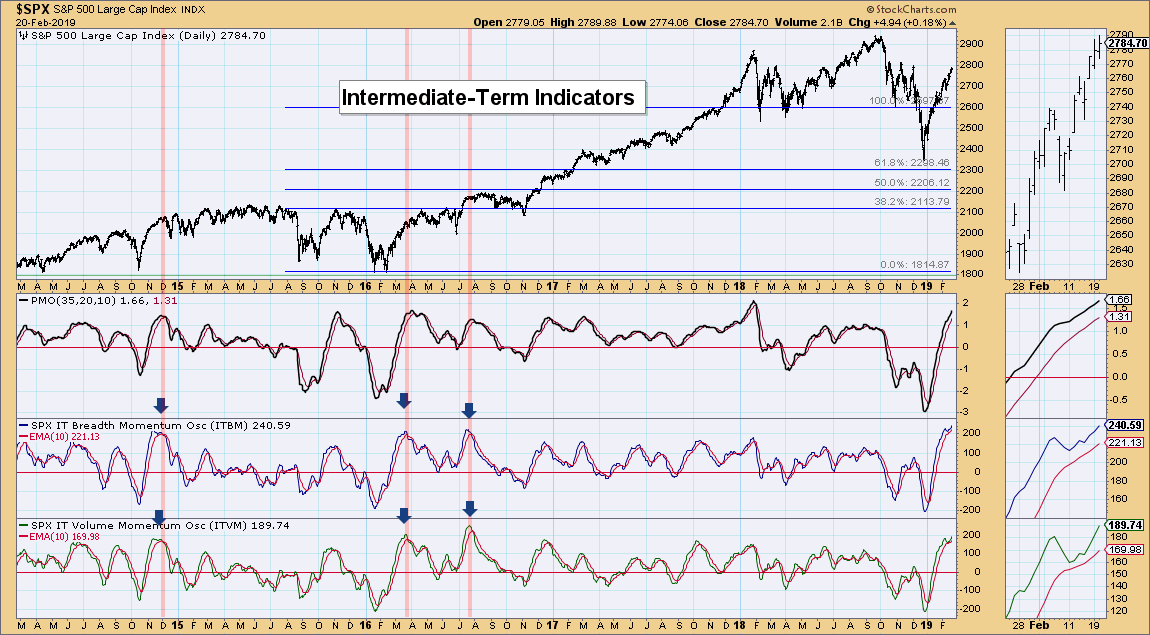
SPX Daily Chart: Unlike the Dow, the OEX, SPX and NDX all have bearish rising wedges on their charts. The expectation should be a breakdown. The PMO is very overbought, especially for a bear market, but it is hard to argue with such a healthy OBV.
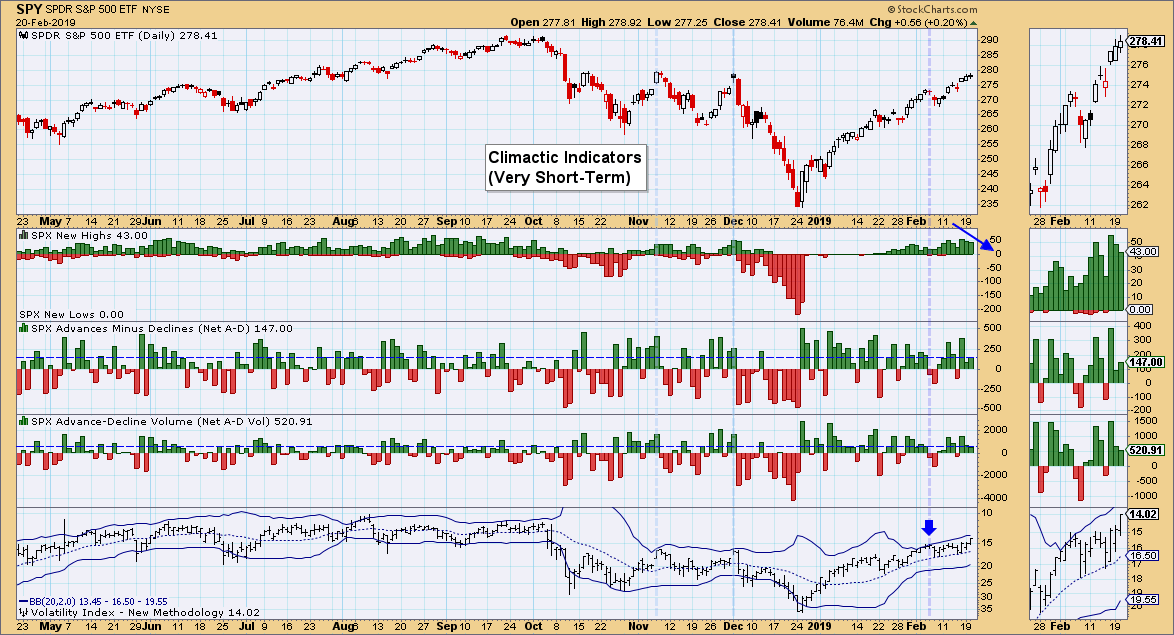
Climactic Market Indicators: I notice that breadth is pulling back somewhat on this rally. I want to see new highs continuing, yet they are falling. The VIX has room to move higher before puncturing the upper Bollinger Band, which is bullish in the very short term.
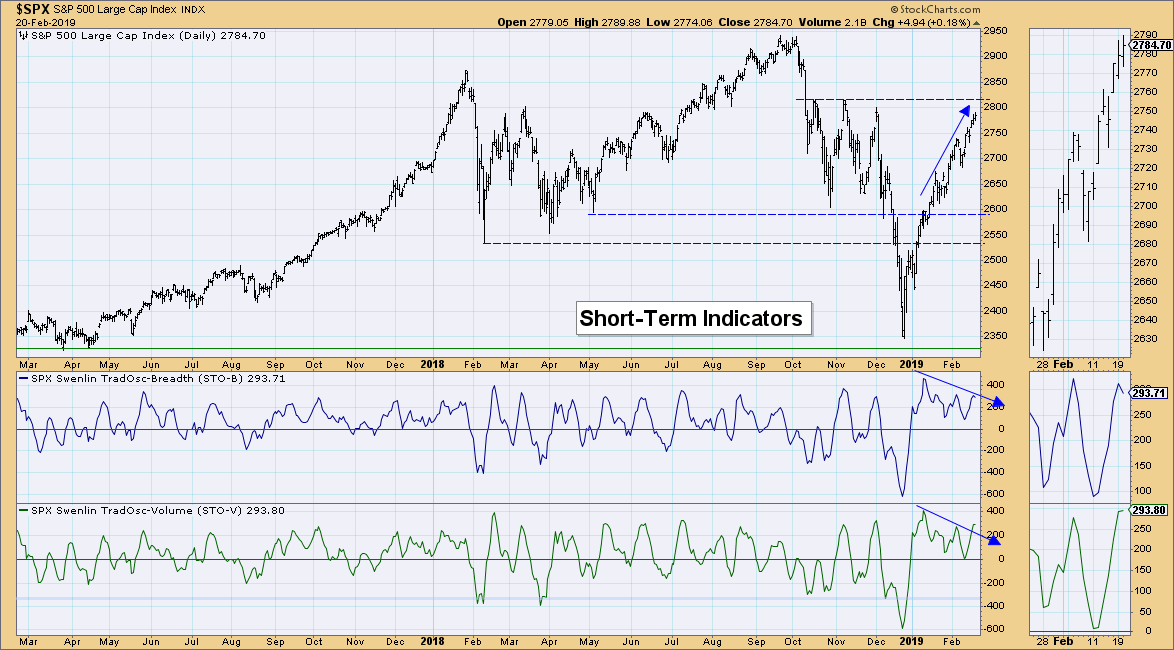
Short-Term Market Indicators: These indicators are basically in a declining trend. What concerns me is the divergence between the STO-B and STO-V. STO-B has topped below its previous high, while STO-V is still technically rising, meaning it will have a higher top. Generally, divergences between the indicators resolve in a decline.
Intermediate-Term Market Indicators: These indicators are extremely overbought. I looked back in time to see other times these readings have hit overbought extremes. The results are bad, but until these indicators actually top, they are still bullish overall.
Conclusion: Carl has said that in a cyclical bear market, we could see price move up to and maybe past 2800 and still consider it a bear market. Two things will change my mind. The first would be a strong breakout to above 2800 accompanied by a LT Trend Model BUY signal, while the second is a serious deceleration or bottom on the monthly PMO.
DOLLAR (UUP)
IT Trend Model: BUY as of 2/7/2019
LT Trend Model: BUY as of 5/25/2018
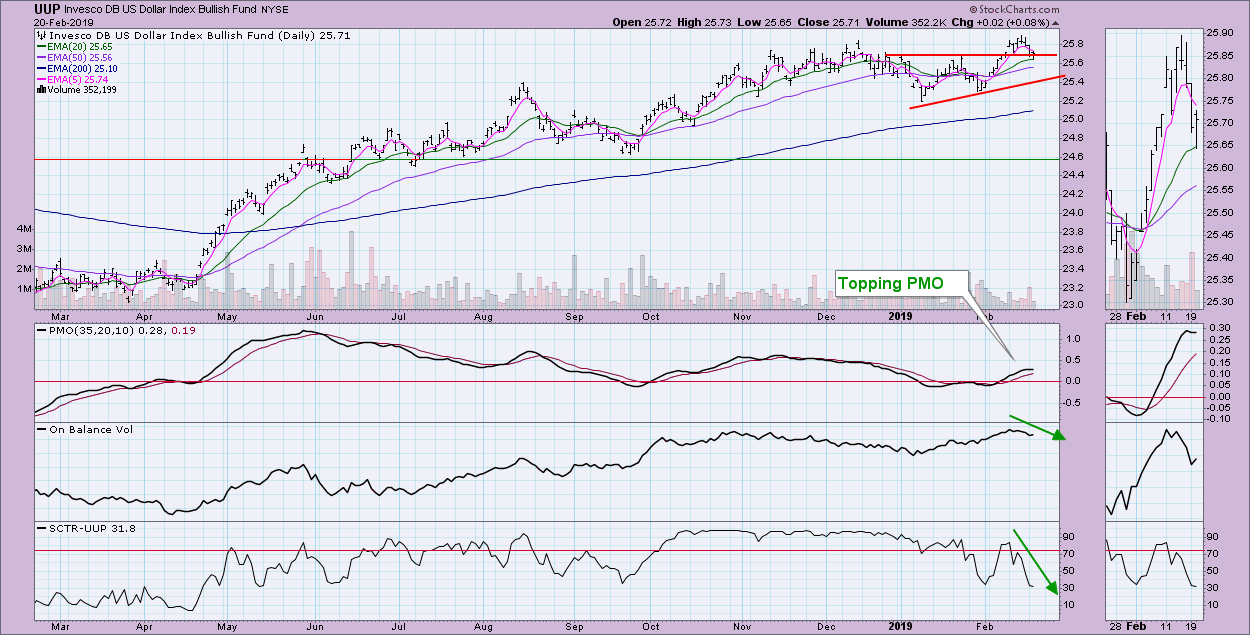
UUP Daily Chart: After executing a bullish ascending triangle, price missed the minimum upside target (the length between lowest low and overhead resistance line) and is in the process of breaking back down. The PMO has topped, while OBV and SCTR are moving in the wrong direction. I expect to see a test of the rising bottoms trend line.
GOLD
IT Trend Model: BUY as of 10/19/2018
LT Trend Model: BUY as of 1/8/2019
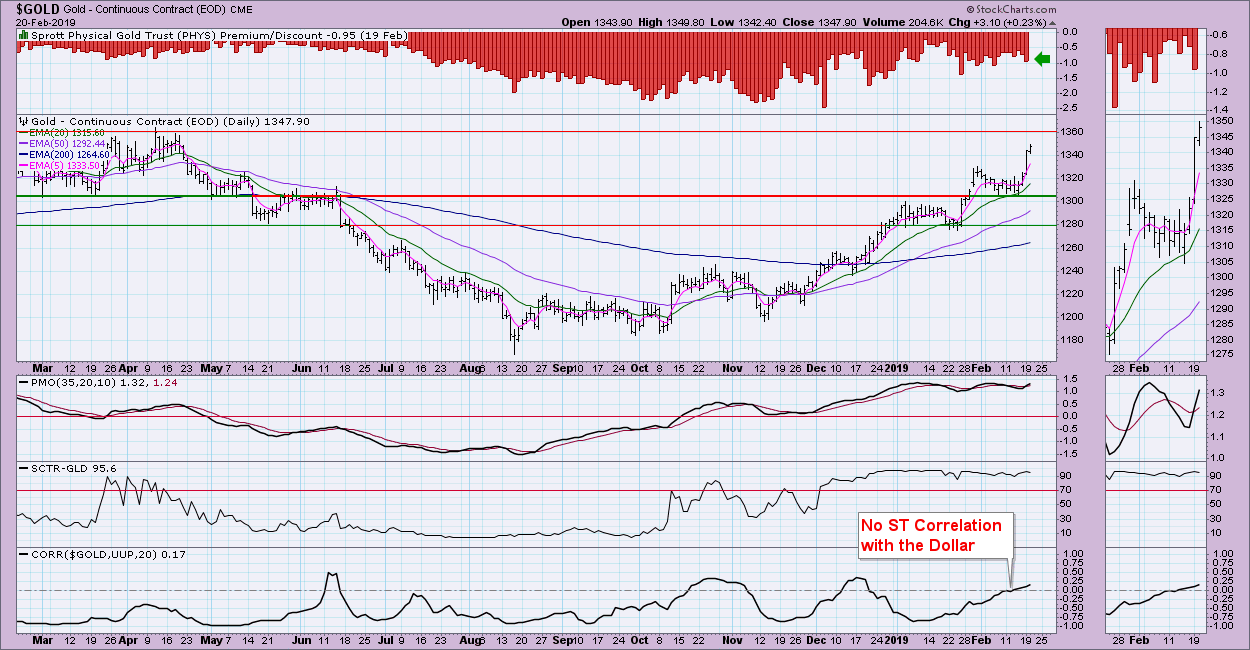
GOLD Daily Chart: After Gold broke out yesterday, we saw a rally continuation today. I like that discounts are still relatively high, meaning that sentiment is still somewhat bearish. As sentiment is contrarian, that is bullish for Gold. I'm expecting a breakout above resistance at 1360. If you want something to worry about, you might notice that the PMO is quite overbought.
CRUDE OIL (USO)
IT Trend Model: Neutral as of 10/29/2018
LT Trend Model: SELL as of 11/23/2018
USO Daily Chart: It isn't a textbook reverse head and shoulders, but I think we can expect good things out of this pattern. Today saw trading above resistance, which is an execution of the head and shoulders. A measurement of the pattern tells us to expect a minimum upside target around $14.00. That's certainly doable, but the 200-EMA could pose a problem.
BONDS (TLT)
IT Trend Model: BUY as of 12/6/2018
LT Trend Model: BUY as of 1/2/2019
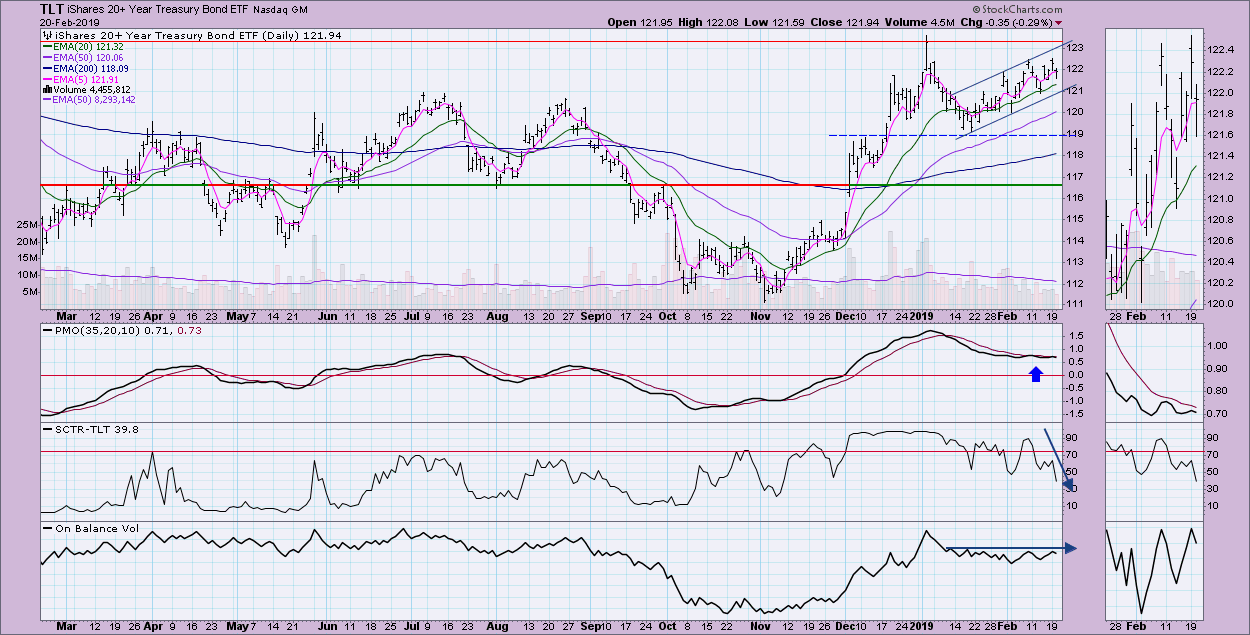
TLT Daily Chart: The PMO is flat, but price is rising. The SCTR has been in a declining trend for over a week. We aren't seeing confirmation from the OBV on this rally as well. Volume and momentum appear to be drying up, so, despite a rising trend channel, I'm not expecting to see price break to new highs.
Technical Analysis is a windsock, not a crystal ball.
Happy Charting!
- Erin
**Don't miss any of the DecisionPoint commentaries! Go to the "Notify Me" box toward the end of this blog page to be notified as soon as they are published.**
NOTE: The signal status reported herein is based upon mechanical trading model signals, specifically, the DecisionPoint Trend Model. These define the implied bias of the price index based upon moving average relationships, but they do not necessarily call for a specific action. They are information flags that should prompt chart review. Further, they do not call for continuous buying or selling during the life of the signal. For example, a BUY signal will probably (but not necessarily) return the best results if action is taken soon after the signal is generated. Additional opportunities for buying may be found as price zigzags higher, but the trader must look for optimum entry points. Conversely, exit points to preserve gains (or minimize losses) may be evident before the model mechanically closes the signal.
Helpful DecisionPoint Links:
DecisionPoint Shared ChartList and DecisionPoint Chart Gallery
Price Momentum Oscillator (PMO)
Swenlin Trading Oscillators (STO-B and STO-V)

