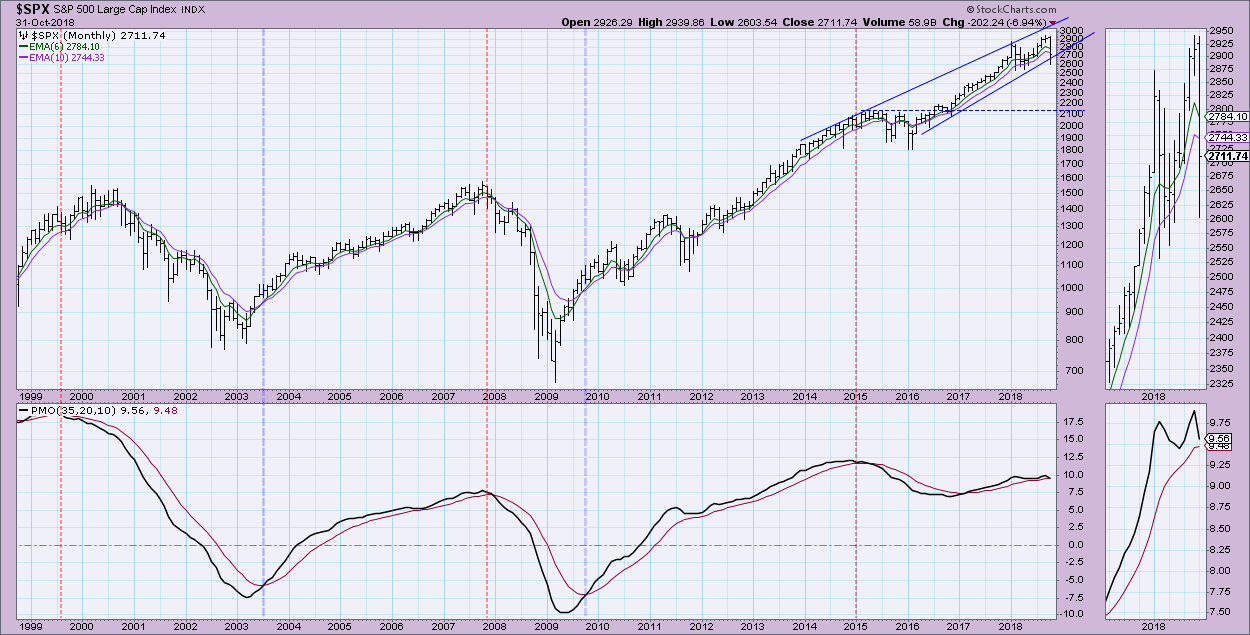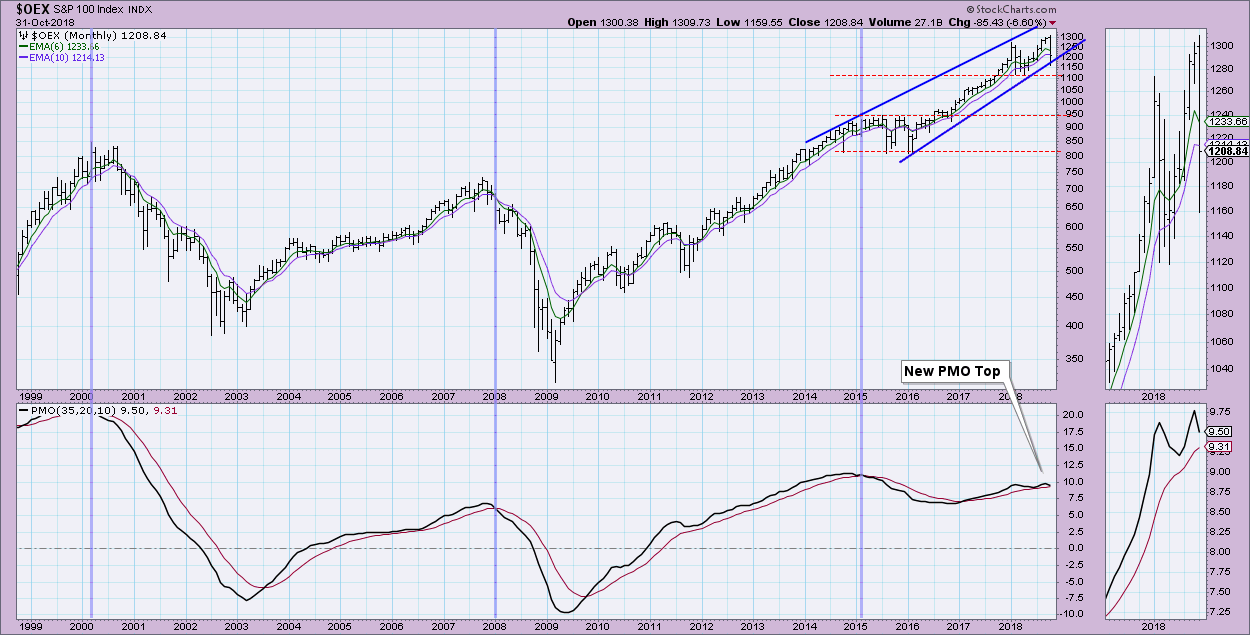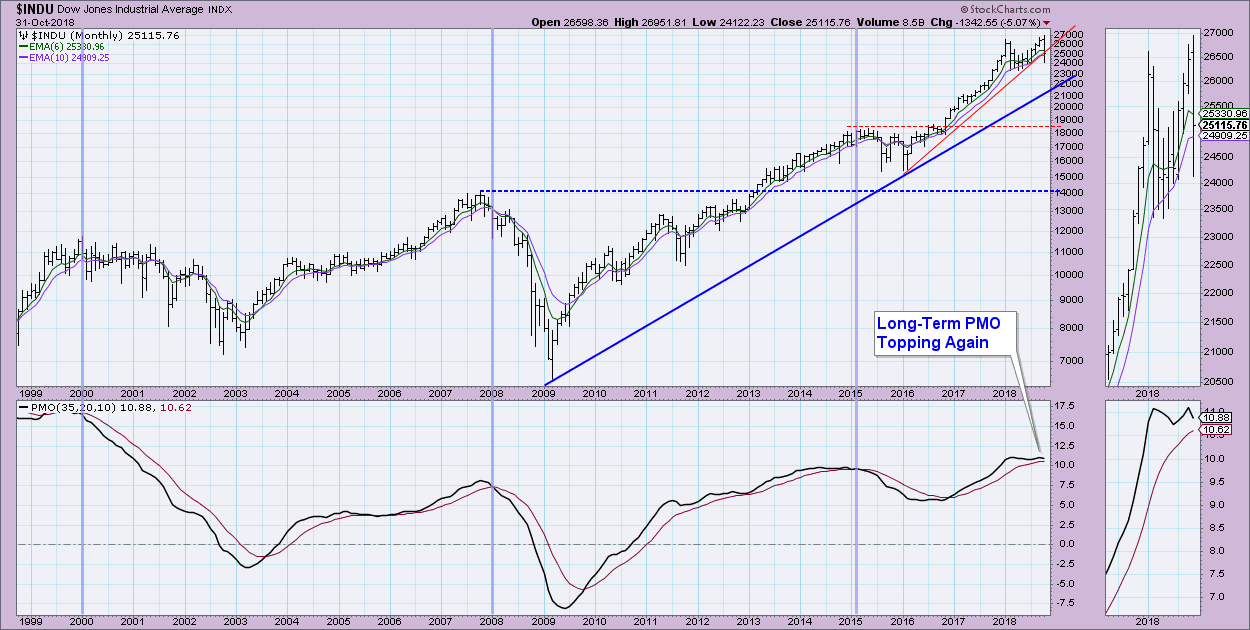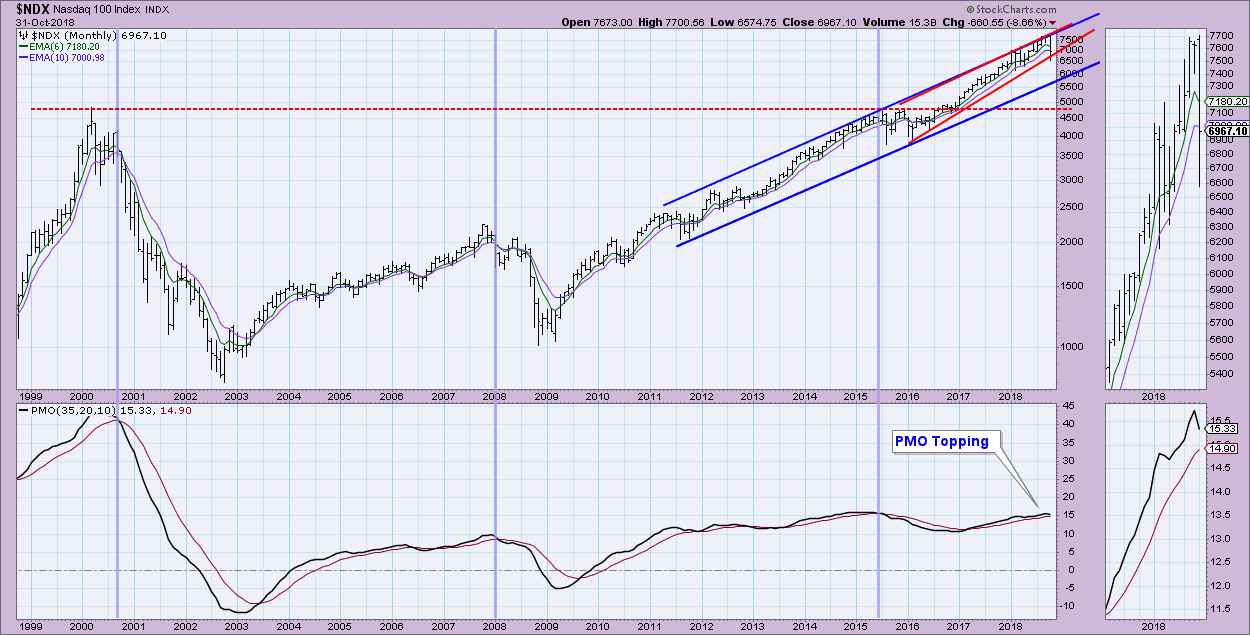
It's been some time since I've written about the monthly charts. Carl usually is the lucky one to cover them given the end of the month often hits on a Friday when he writes the Weekly Wrap. I thought today I'd cover the monthly charts for the DP Scoreboard indexes as well as a look at the SP400 ETF (IJH) and Russell 2000 ETF (IWM). I'll finish it off with the monthly charts of the "Big Four", Dollar, Gold, Oil and Bonds. Watch tomorrow's MarketWatchers LIVE show at 12:00p EST where I'll be talking through all of these charts with more detail. You might also be able to catch the DP Monthly Review in reruns on StockCharts TV or on YouTube next week.
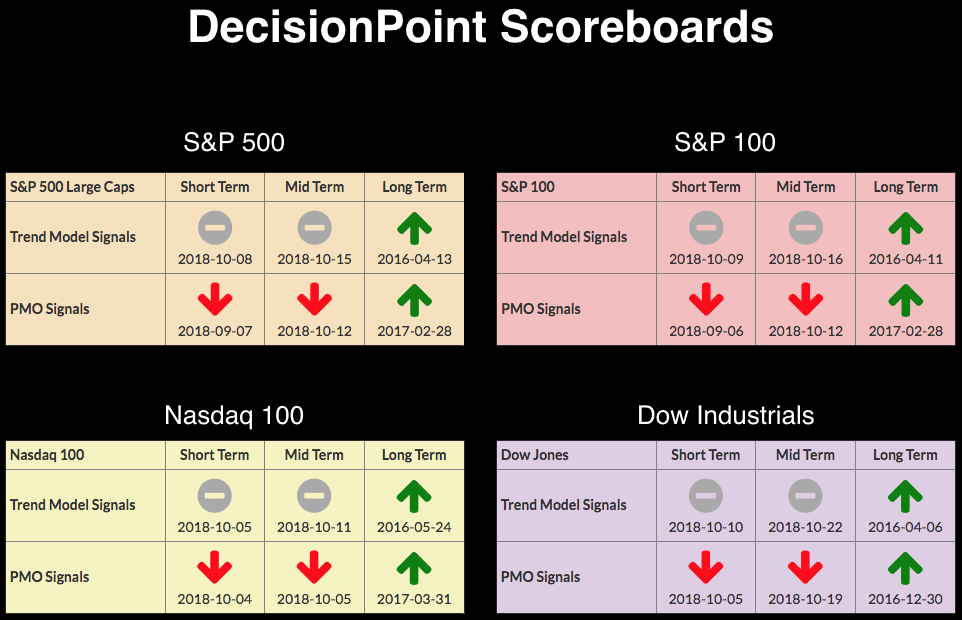
Looking at the DP Scoreboards above, I would like you to note the "Long-Term PMO Signals". These signals come from the monthly PMOs. On all of these indexes, you can see that the PMOs, while on BUY signals, have all topped out on the monthly chart. We did have a top after the January/February correction that didn't result in SELL signals, but we also were holding the rising bottoms trendlines. Now we see three bearish rising wedges (SPX, OEX, NDX) in the process of executing and the Dow is losing long-term support. Be careful.
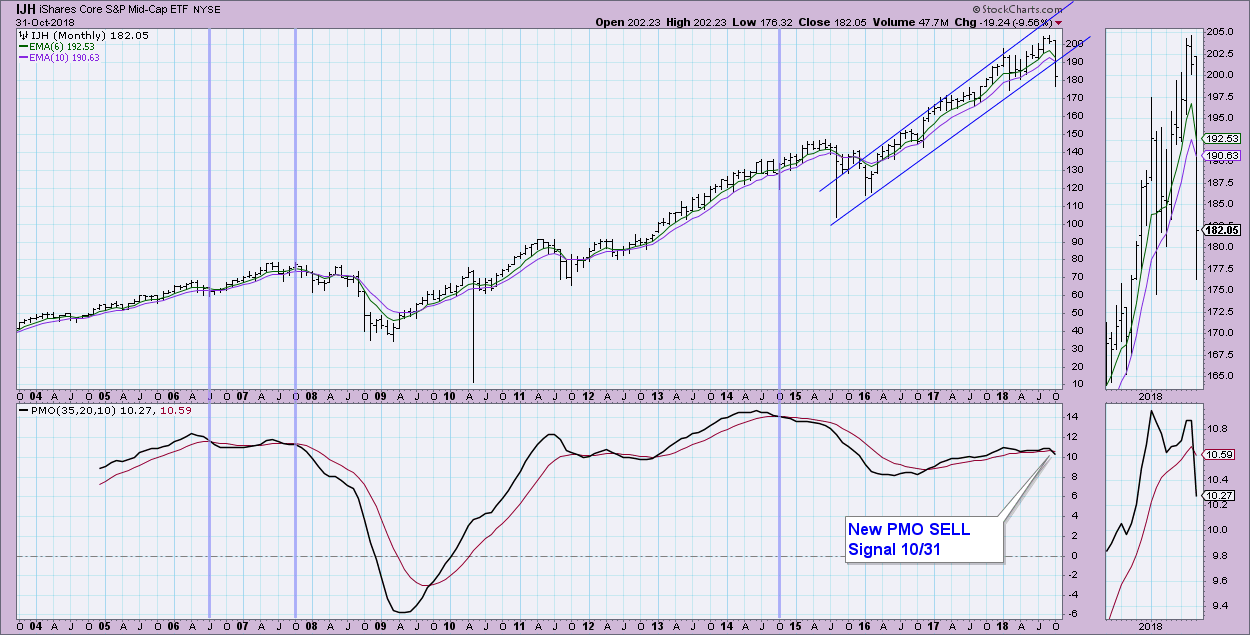
Mid-caps had been traveling in a rising trend channel, but this month saw a major breakdown. In the case of IJH, a Long-Term PMO SELL signal is now in place.
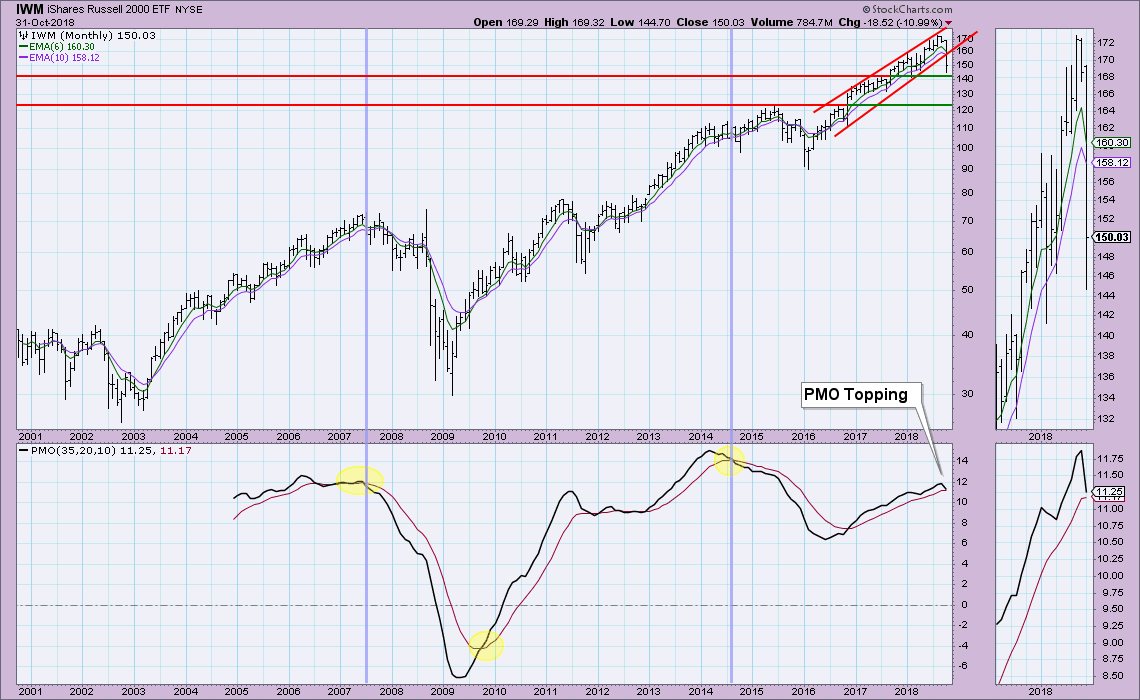
IWM has decisively executed the bearish rising wedge and is now testing support along 2017 tops. The Dollar is poised to do well, and typically small-caps tend to benefit. My concern right now is that SP400 and Russell 2000 are a bellwether for the large-caps. They have had decisive breakdowns already. IWM managed to just survive a potential PMO SELL signal, but any type of follow on decline next month and the SELL signal will certainly arrive.
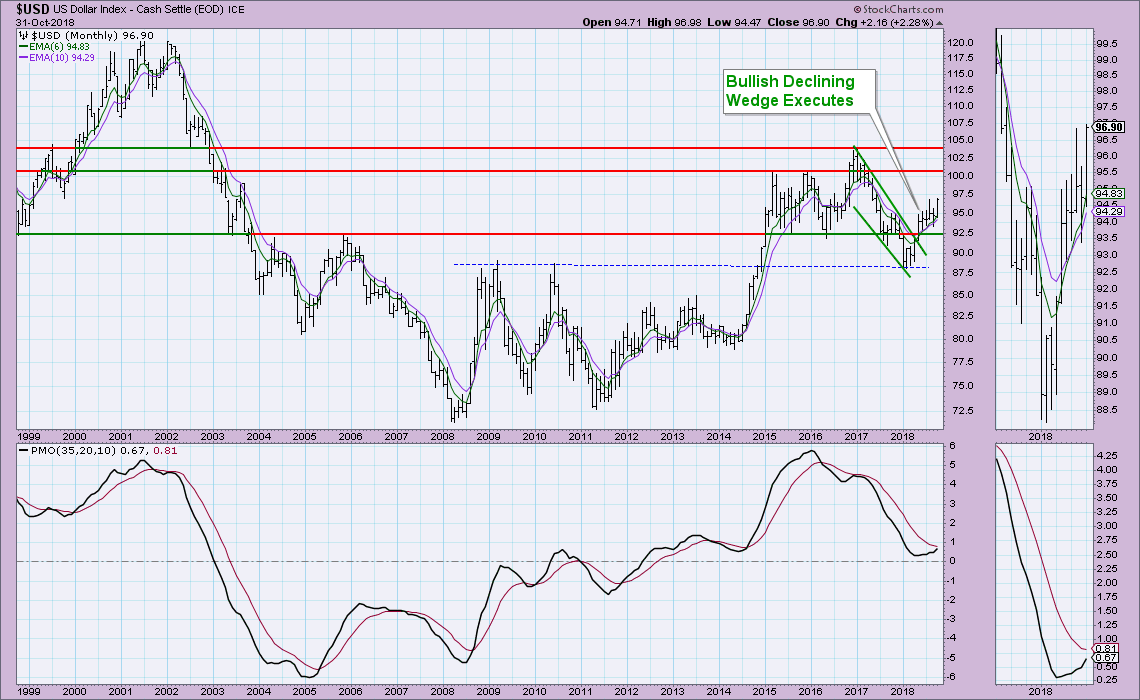
The Dollar is breaking out once again, closing out the month at a 2018 high. Overhead resistance is at 100 and 104. The PMO is nearing a BUY signal. I'm bullish on the Dollar.
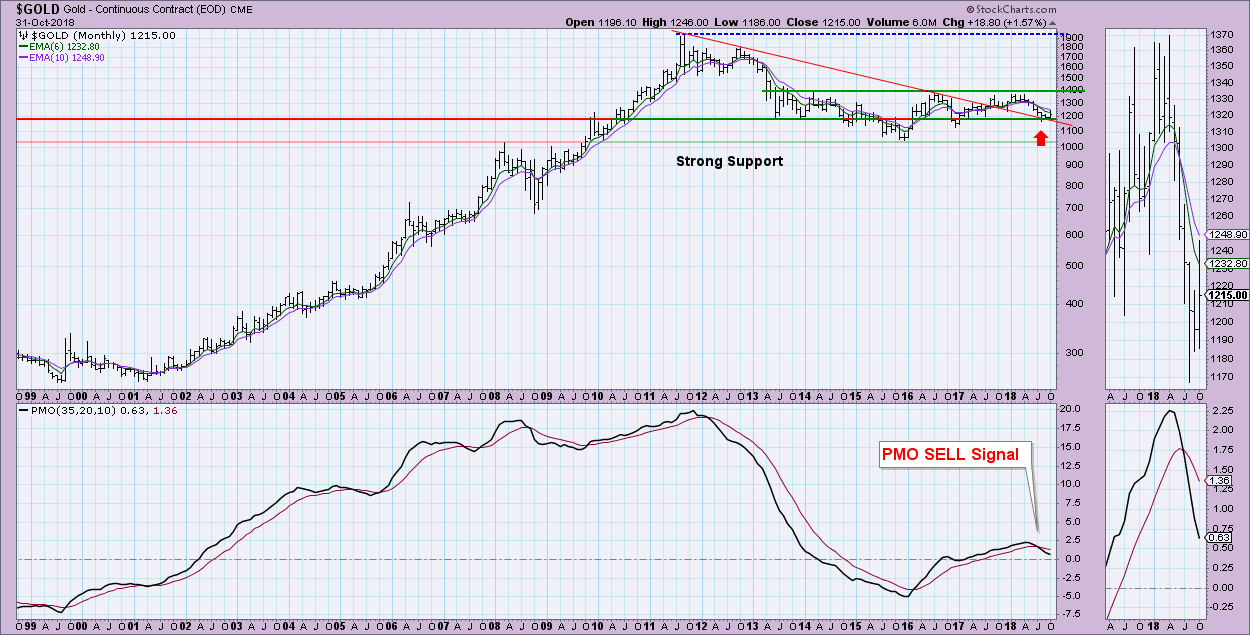
Gold is clinging to support at 1195. The declining tops trendline crosses right along that support as well. The long-term PMO is a clear problem given that it is headed straight down despite support holding. The long-term picture is mixed. What's interesting is that Gold didn't rally like one might expect during an October that saw the SPX down nearly 7%.
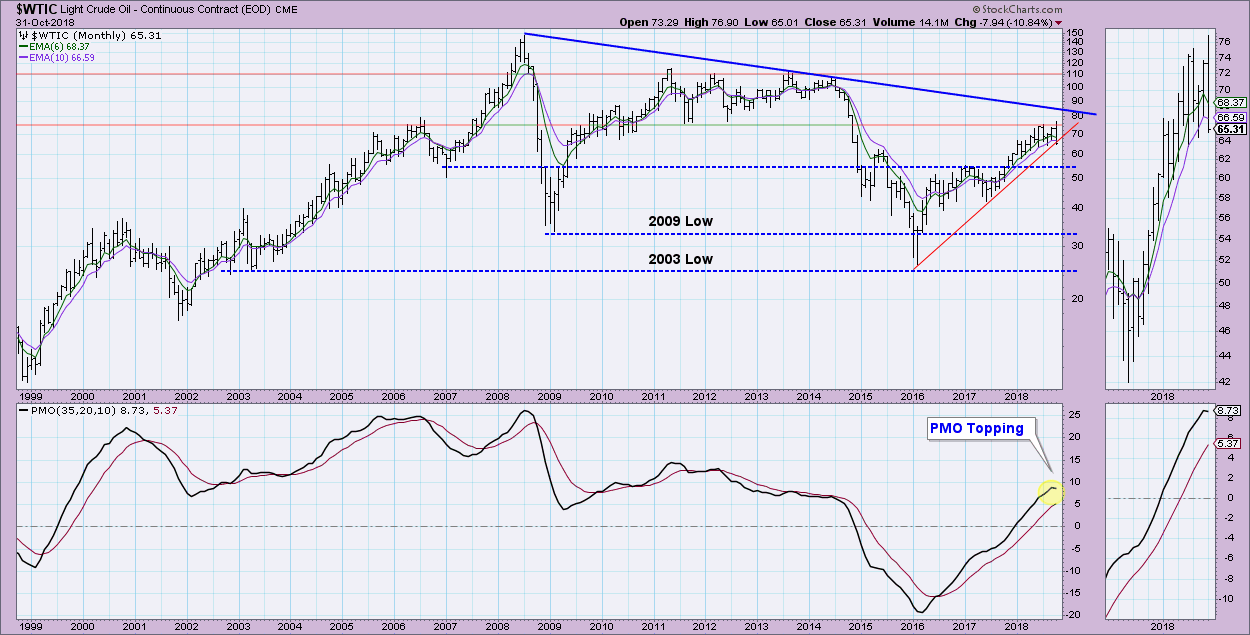
It was a very bad month for Oil which was down almost 11% in October. Rising bottoms trendline is just barely holding and overhead resistance at $75 is holding pat. The PMO is topping, but it's only been this month that took it lower. Resistance and declining tops trendline are merging. We need momentum to move past that level and the PMO is telling us that there is no positive momentum.
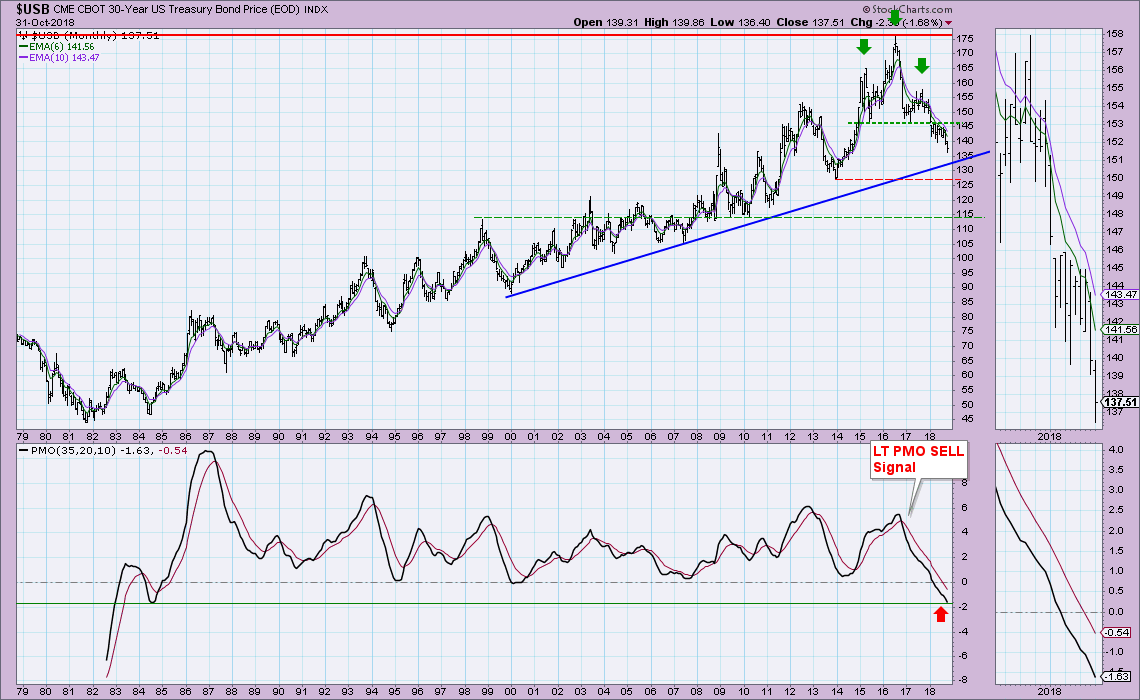
The very long-term head and shoulders pattern on Bonds executed at the beginning of the year. It will need to hold the $135 level in order to preserve the rising trend. At this point, we have a long-term PMO that is reaching depths not seen since we started calculating the PMO. The minimum downside target of the head and shoulders pattern is around $115. There are few areas of support along the way with the most notable at the 2013 low. The picture remains very bearish and consequently so am I.
Technical Analysis is a windsock, not a crystal ball.
Happy Charting!
- Erin
Helpful DecisionPoint Links:
DecisionPoint Shared ChartList and DecisionPoint Chart Gallery
Price Momentum Oscillator (PMO)
Swenlin Trading Oscillators (STO-B and STO-V)
**Don't miss DecisionPoint Commentary! Add your email below to be notified of new updates"**

