 I'm going to show you one of the ways you can use a "DecisionPoint" CandleGlance ChartStyle to immediately see, on one page, the health of all market sectors. I have written about how to use CandleGlance for sifting scans and how to set-up a "DecisionPoint" CandleGlance ChartStyle. Let's combine some of that knowledge and use DP CandleGlance to evaluate the sectors.
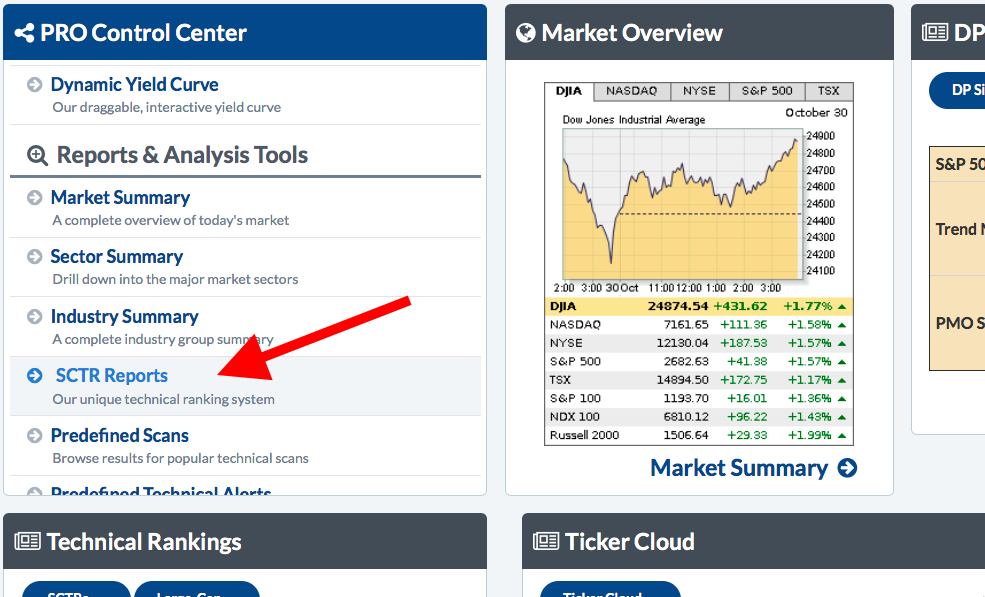
There are a few ways to find the Sector CandleGlance. First, from the homepage, click on the Sector Summary the Control Center on the left:

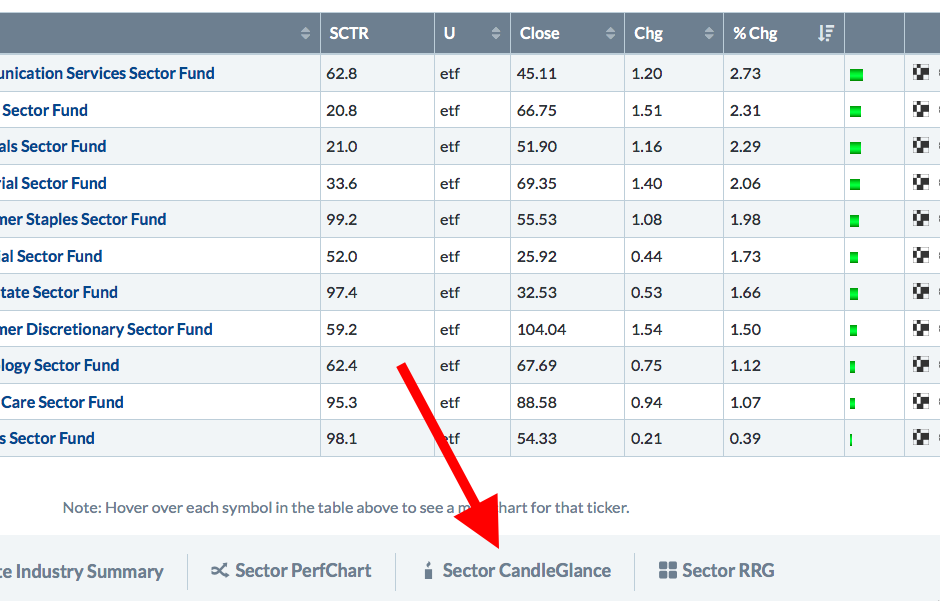
and then click on "Sector CandleGlance" at the bottom of the page:
 .
.
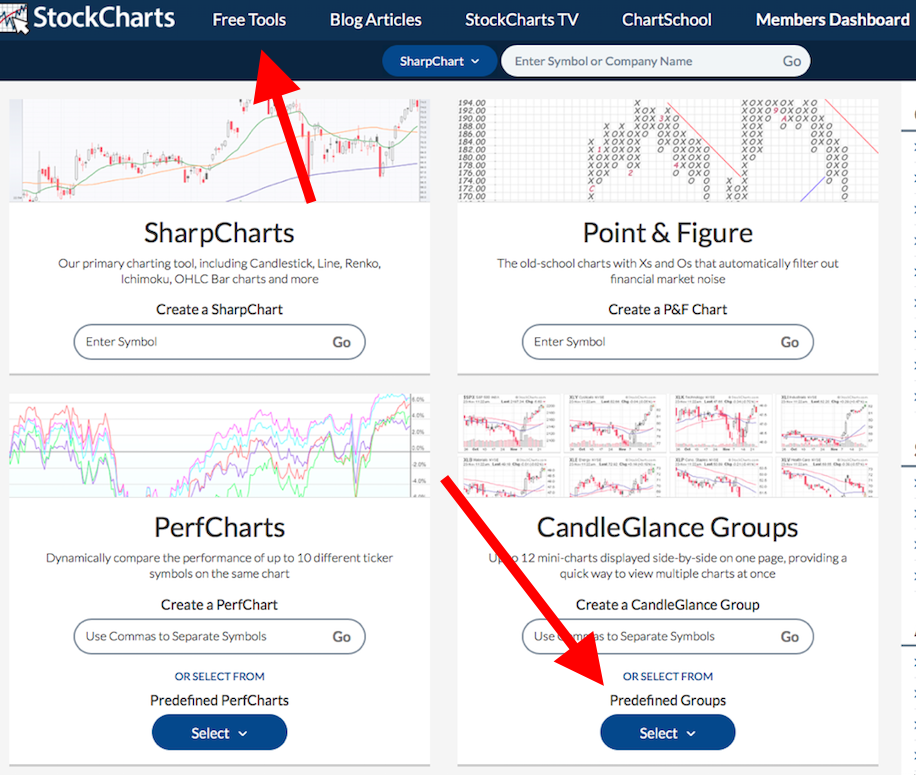
Another way to reach the Sector CandleGlance is from the Free Charts tab on the homepage.

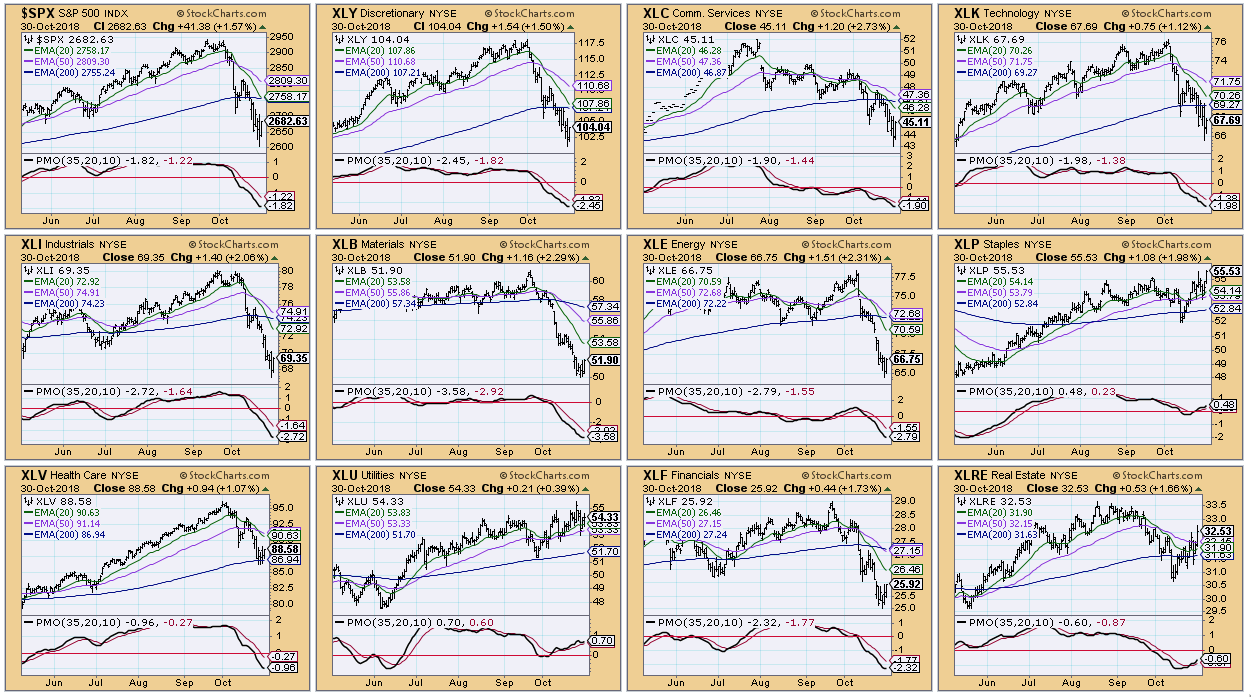
Now we know how to set up a DecisionPoint CandleGlance, use it to sift scans and view sectors in CandleGlance. Here's what my Sector CandleGlance looks like:
 Studying the sectors in DP CandleGlance, I can see the configuration of the PMO and Trend Models. It is quite clear that the defensive sectors have enjoyed a resurgence as the market environment has gotten volatile. The only sectors on PMO BUY signals are Utilities, Real Estate and Consumer Staples. Looking at their charts, we see the PMO rising and a positive configuration of the EMAs (with the exception of XLRE, the 20-EMA is about to cross above the 50-EMA).
 Now we want to look at which sectors may be having a change of character. I picked out Materials, Health Care and Financials. All three have a decelerating PMO and all three have established some short-term support and are ready for short-term breakouts.

There are many problems with these three sectors. XLV is probably the most healthy (no pun intended) given the LT Trend Model BUY signal (50-EMA > 200-EMA) and a nice margin between the 50-EMA and the 200-EMA. Health Care tends to be a defensive sector and thus hasn't been hit as hard as some of the other sectors. XLB is in a bear market configuration with the 50-EMA well below the 200-EMA and XLF just entered a bear market as the 50-EMA has crossed below the 200-EMA. All three of these sectors have a lot of work to do, the first being a breakout above early October lows. The point here is that we were able to immediately pick these sectors out using the PMO and CandleGlance.
The market is still tenuous as bulls try desperately to right the ship and bears keep taking control. Based on the sector rotation model I learned from John Murphy, we need to start seeing leadership move toward Financials and more aggressive sectors like Cyclicals and Technology.
In conclusion, DecisionPoint CandleGlance is invaluable to me. I have my own analysis process and having a CandleGlance tailored to that process gives me the big picture through the lens of my own indicators.
Technical Analysis is a windsock, not a crystal ball.
Happy Charting!
- Erin
Helpful DecisionPoint Links:
DecisionPoint Shared ChartList and DecisionPoint Chart Gallery
Price Momentum Oscillator (PMO)
Swenlin Trading Oscillators (STO-B and STO-V)
**Don't miss DecisionPoint Commentary! Add your email below to be notified of new updates"**
