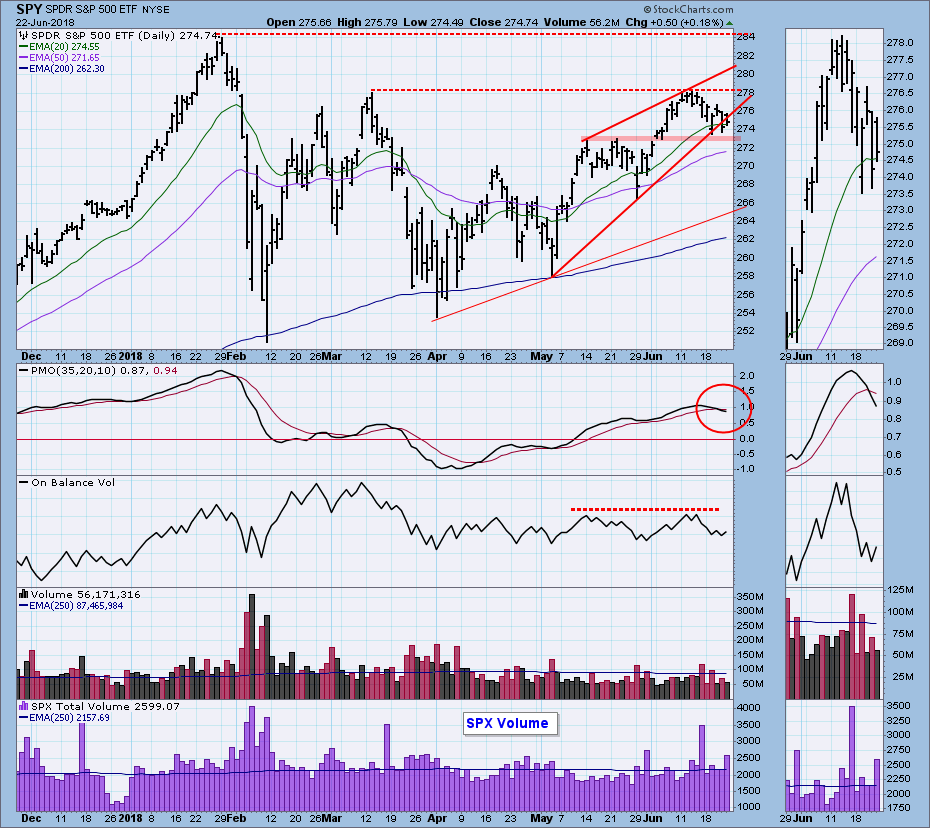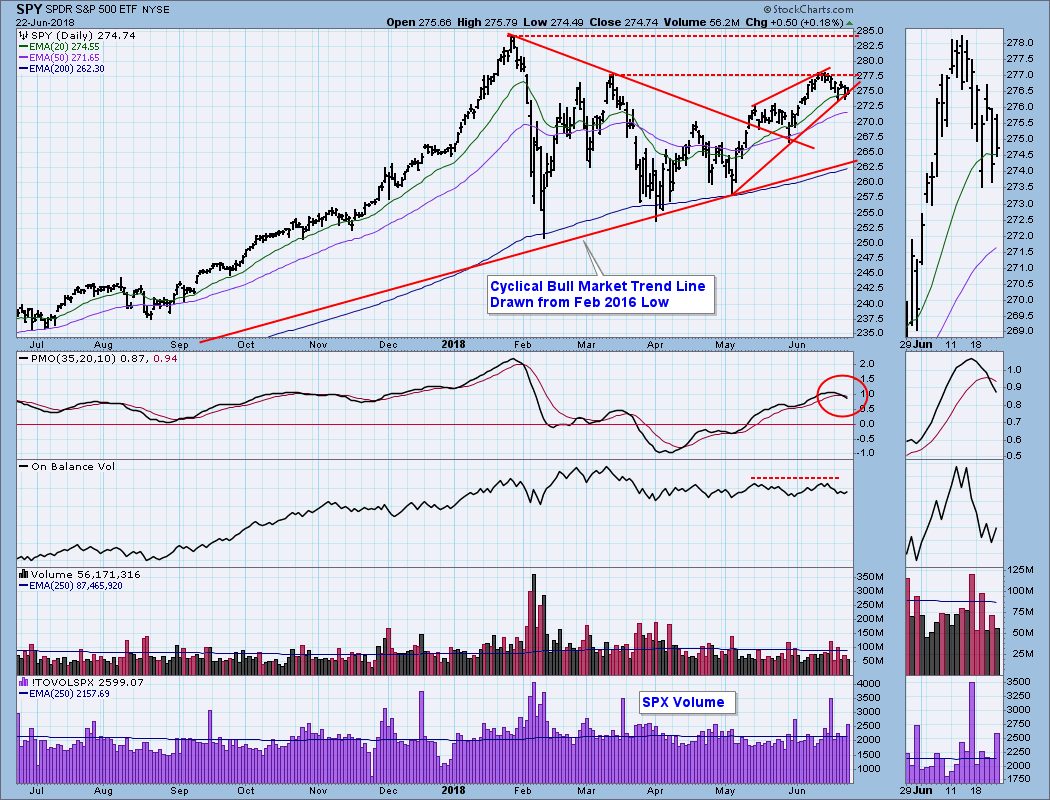
The market has been turned back from the horizontal resistance drawn across the March top, but it has managed to stay above the support drawn across the May tops. However, there is still the mechanism of the bearish rising wedge pattern, which is reinforced by an OBV negative divergence, and the PMO SELL signal. This setup is not immutable, but, as it stands right now, the evidence is saying to look for more downside. Let's see how that might get.
The DecisionPoint Weekly Wrap presents a succinct end-of-week assessment of the trend and condition of the stock market (S&P 500), the U.S. Dollar, Gold, Crude Oil, and Bonds.
SECTORS
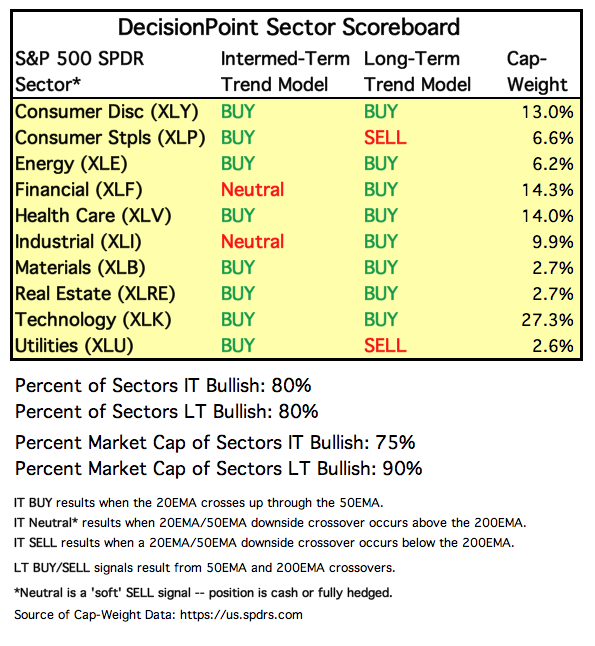
Each S&P 500 Index component stock is assigned to one, and only one, of 10 major sectors. This is a snapshot of the Intermediate-Term and Long-Term Trend Model signal status for those sectors.
STOCKS
IT Trend Model: BUY as of 5/11/2018
LT Trend Model: BUY as of 4/1/2016
SPY Daily Chart: Not really anything to add to what I said above.
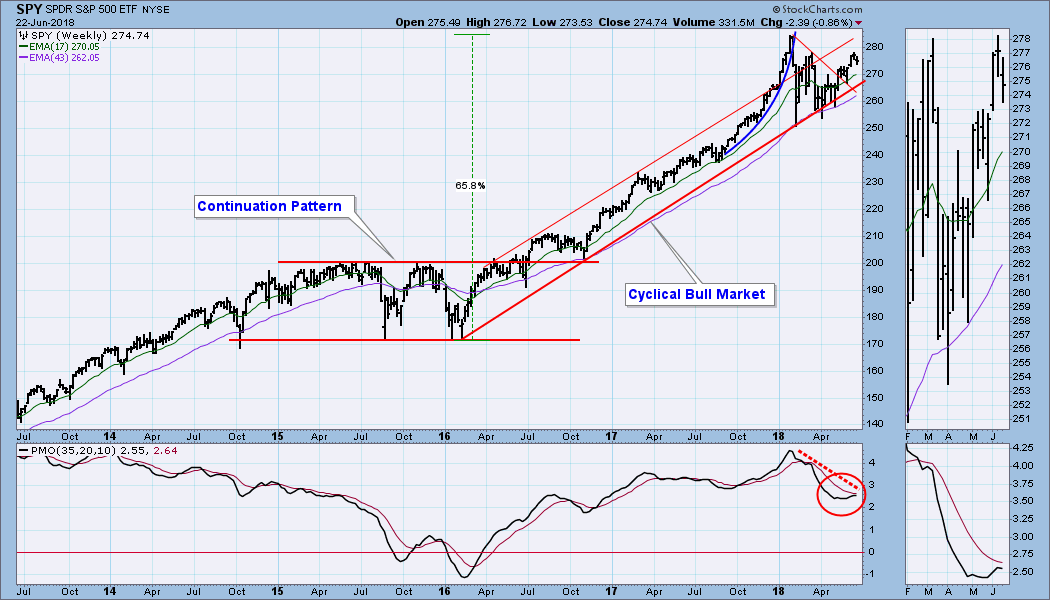
SPY Weekly Chart: SPY has remained within the cyclical bull market rising trend channel, but the weekly PMO topped below the signal line on Friday, an especially bearish configuration. That weekly PMO top also formed a negative divergence.
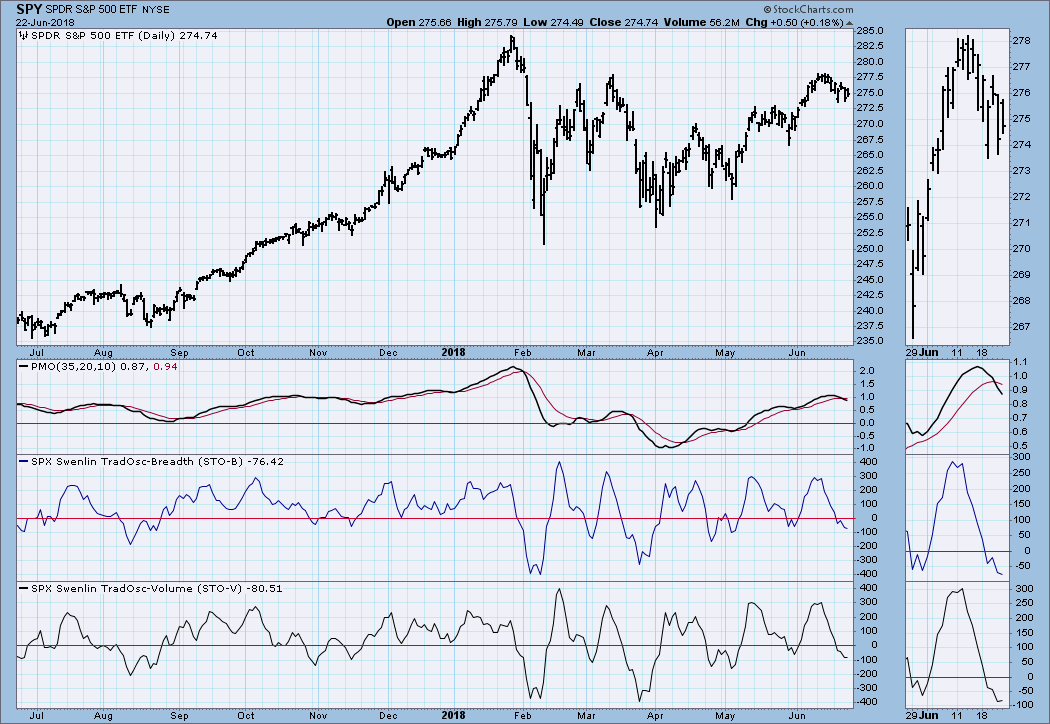
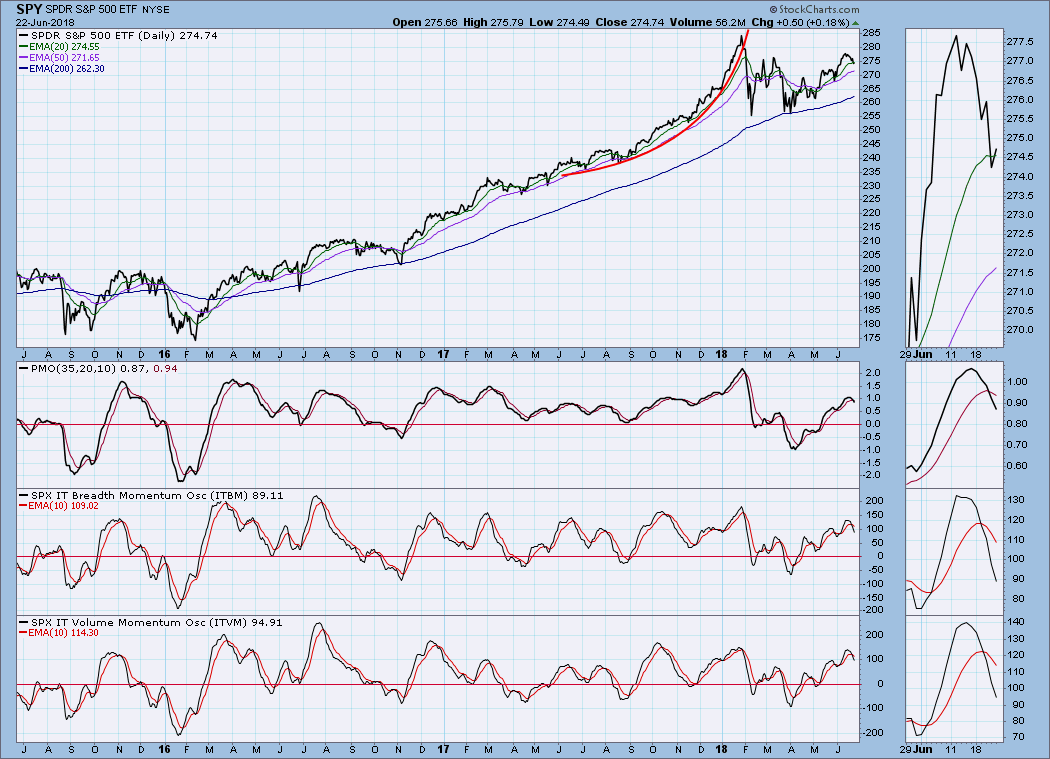
Short-Term Market Indicators: The STO-B and STO-V are slightly oversold, about where they were about a month ago.
Intermediate-Term Market Indicators: The ITBM and ITVM are below their signal lines and falling. They are somewhat overbought and allow for a good sized price decline; however, they have already declined about the same amount as the declines from the two prior indicator tops, and we could make a case that the current decline has hit a cycle low.
Conclusion: April and May saw short-term tops that resulted in minor pullbacks. Now we have just experienced a pullback that looks a lot like the previous two, and we could make a case for the pullback having run its course. Nevertheless, there is something a little different about this top -- our three primary indicators on the chart above were more overbought this time, so maybe the third time is charmed. If we get a bounce and the daily PMO bottoms, I will assume that the short correction is over. Otherwise, a breakdown from the rising wedge is most likely.
DOLLAR (UUP)
IT Trend Model: BUY as of 4/24/2018
LT Trend Model: BUY as of 5/25/2018
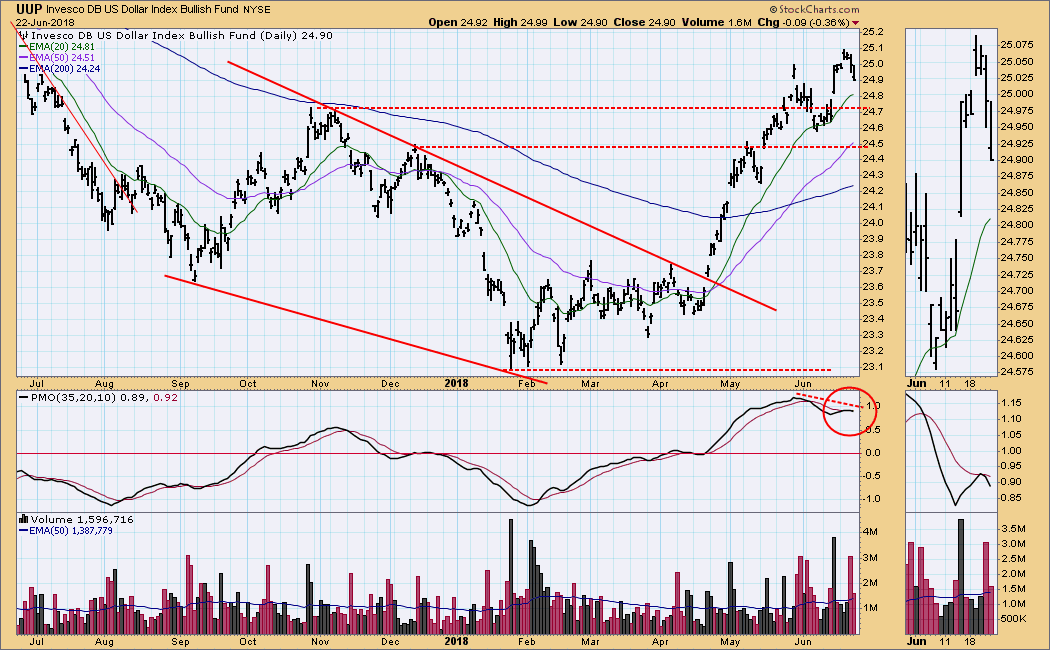
UUP Daily Chart: UUP has topped, and a daily PMO negative divergence has appeared, so I'm looking for the decline to continue for a while.
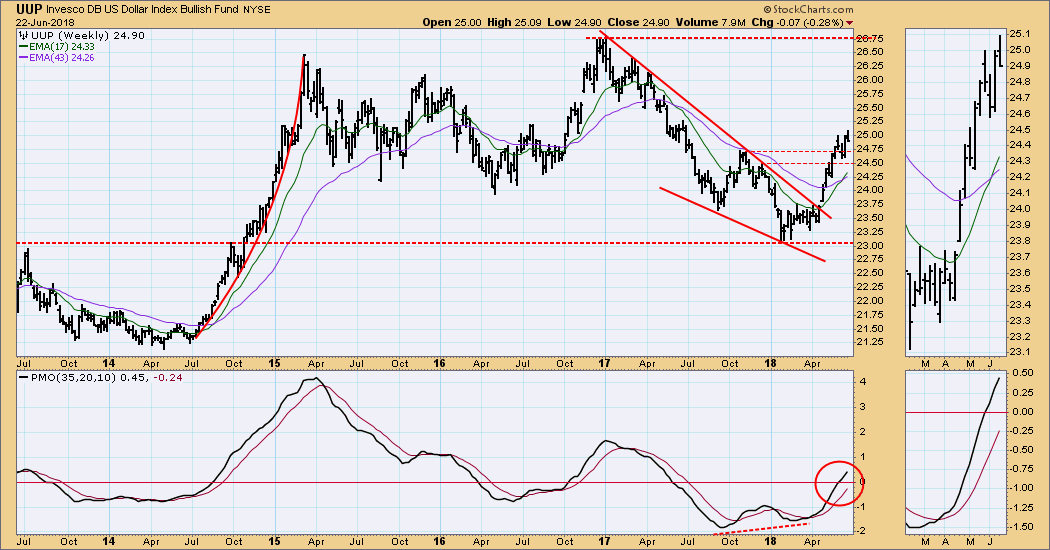
UUP Weekly Chart: This week's reversal is the only negative issue in this time frame.
GOLD
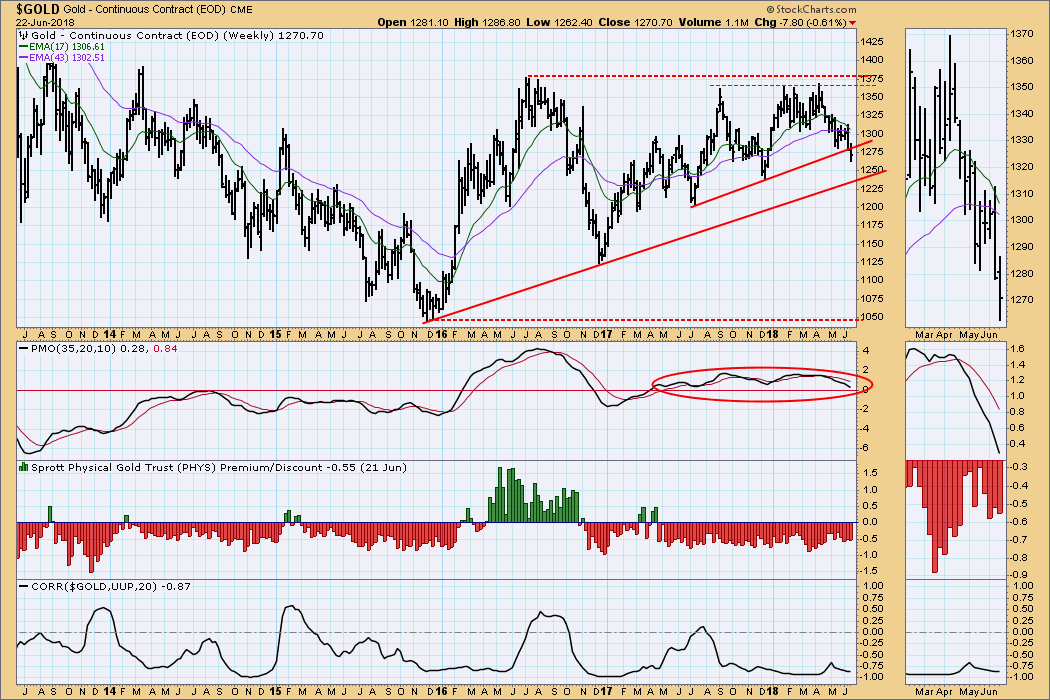
IT Trend Model: NEUTRAL as of 5/2/2018
LT Trend Model: SELL as of 6/22/2018
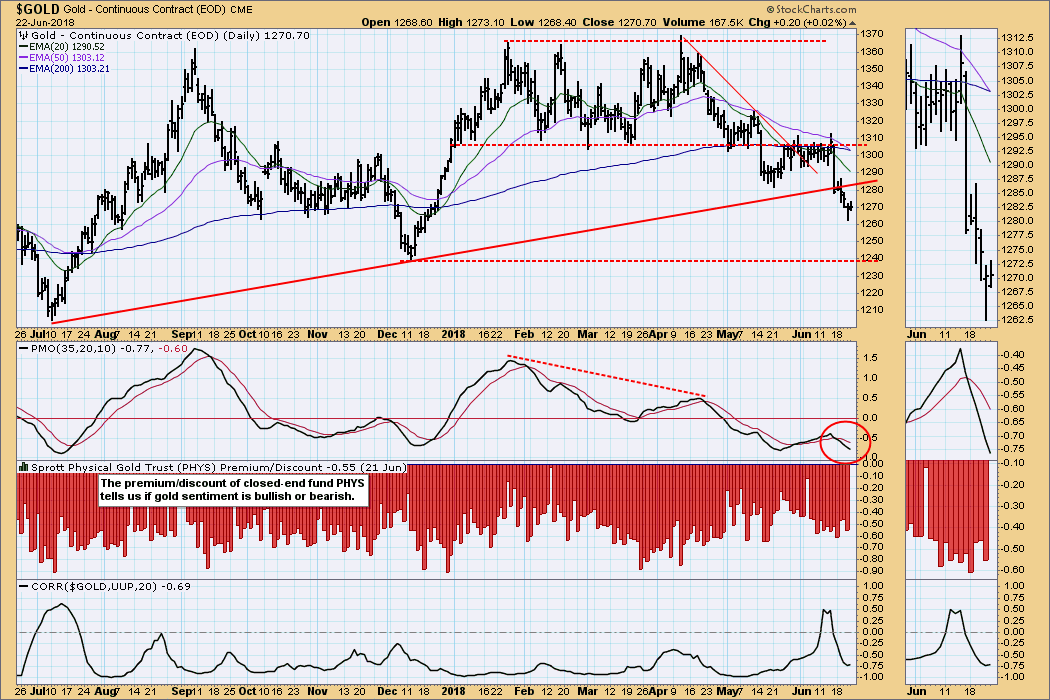
GOLD Daily Chart: The 50EMA crossed down through the 200EMA, generating a LT Trend Model SELL signal.
GOLD Weekly Chart: This week gold dropped below a secondary rising trend line, and the weekly PMO dropped below the flat range it has maintained for over a year. Gold now seems to be headed for a test of the primary (bull market) rising trend line drawn from the 2015 low.
CRUDE OIL (USO)
IT Trend Model: NEUTRAL as of 6/15/2018
LT Trend Model: BUY as of 11/2/2017
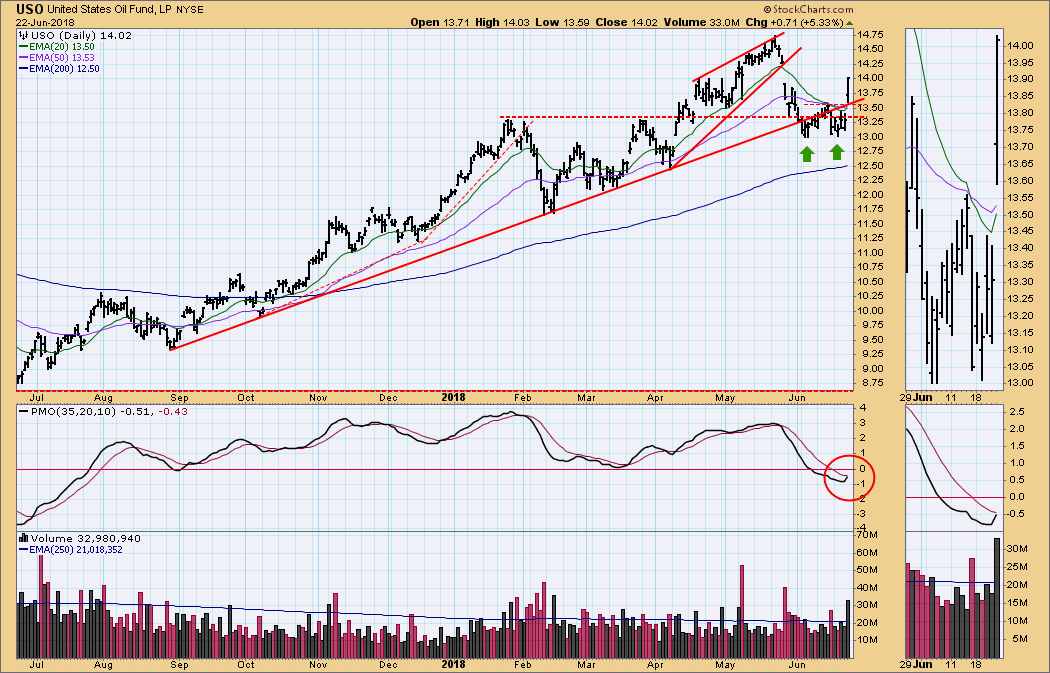
USO Daily Chart: On Friday OPEC announced an increased production target, but it was not as high as expected. As a result, crude decisively shot out of a double bottom formation. If there is follow through next week, a new IT Trend Model should result. Important horizontal resistance is overhead at 16.00.
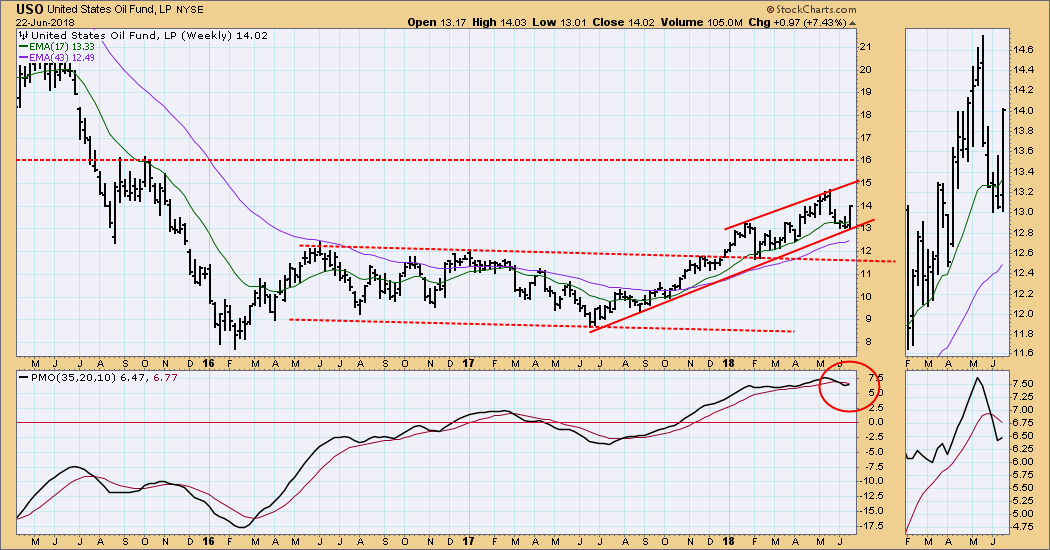
USO Weekly Chart: In this time frame the rising trend channel has been maintained, and the weekly PMO turned up. The fact that the PMO is so overbought makes me wonder it the OPEC effect will persist or if it is just a flash in the pan.
BONDS (TLT)
IT Trend Model: BUY as of 6/1/2018
LT Trend Model: SELL as of 2/8/2018
TLT Daily Chart: The rapid advance in May has been followed by a period of churning, and the daily PMO has been flat to slightly rising.
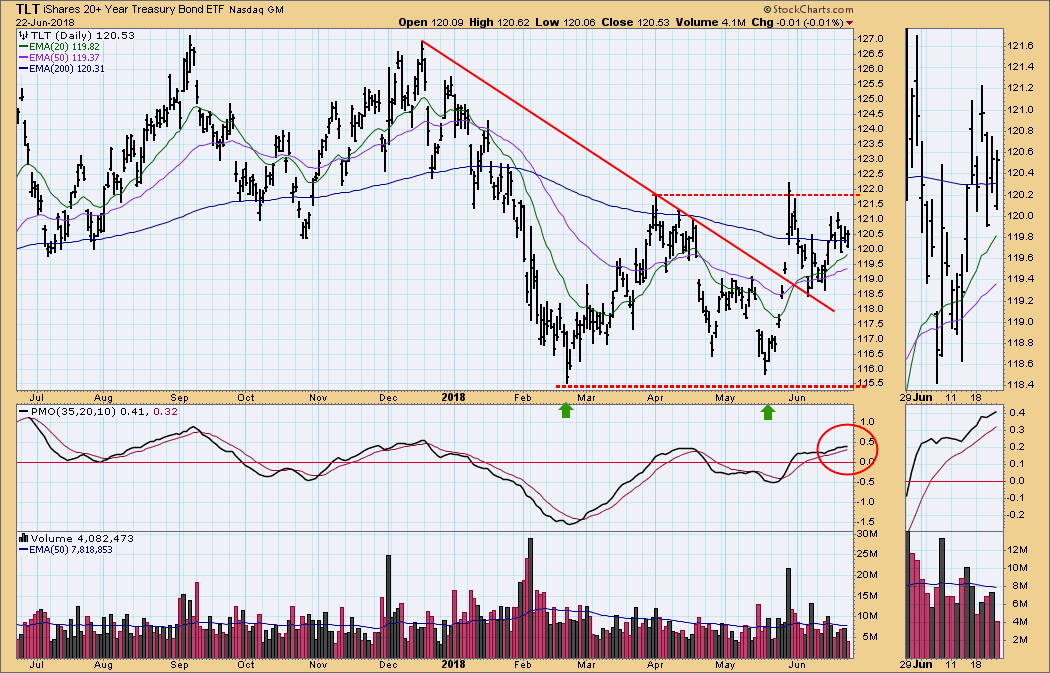
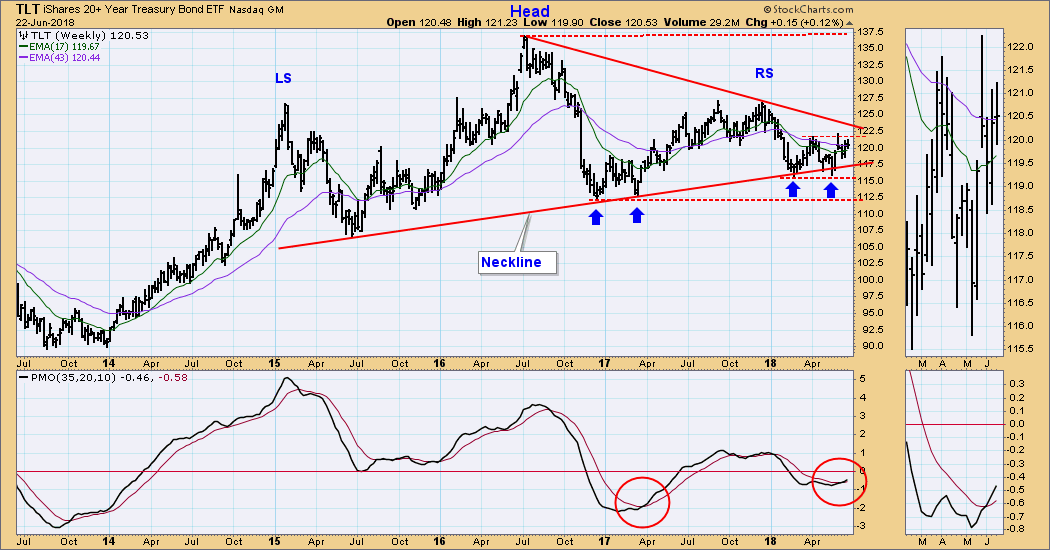
TLT Weekly Chart: The shorter-term double bottom seems about to hijack the longer-term head and shoulders pattern. Primary evidence for this conclusion is that the weekly PMO has crossed up through the signal line. A similar double bottom outcome can be seen in the first part of 2017. Having said that, I must caution that similar setups do not necessarily result in similar outcomes, but it is reasonable to anticipate a similar outcome until evidence to the contrary appears.
**Don't miss any of the DecisionPoint commentaries! Go to the "Notify Me" box toward the end of this blog page to be notified as soon as they are published.**
Technical Analysis is a windsock, not a crystal ball.
Happy Charting!
- Carl
NOTE: The signal status reported herein is based upon mechanical trading model signals, specifically, the DecisionPoint Trend Model. They define the implied bias of the price index based upon moving average relationships, but they do not necessarily call for a specific action. They are information flags that should prompt chart review. Further, they do not call for continuous buying or selling during the life of the signal. For example, a BUY signal will probably (but not necessarily) return the best results if action is taken soon after the signal is generated. Additional opportunities for buying may be found as price zigzags higher, but the trader must look for optimum entry points. Conversely, exit points to preserve gains (or minimize losses) may be evident before the model mechanically closes the signal.
Helpful DecisionPoint Links:
DecisionPoint Shared ChartList and DecisionPoint Chart Gallery
Price Momentum Oscillator (PMO)
Swenlin Trading Oscillators (STO-B and STO-V)

