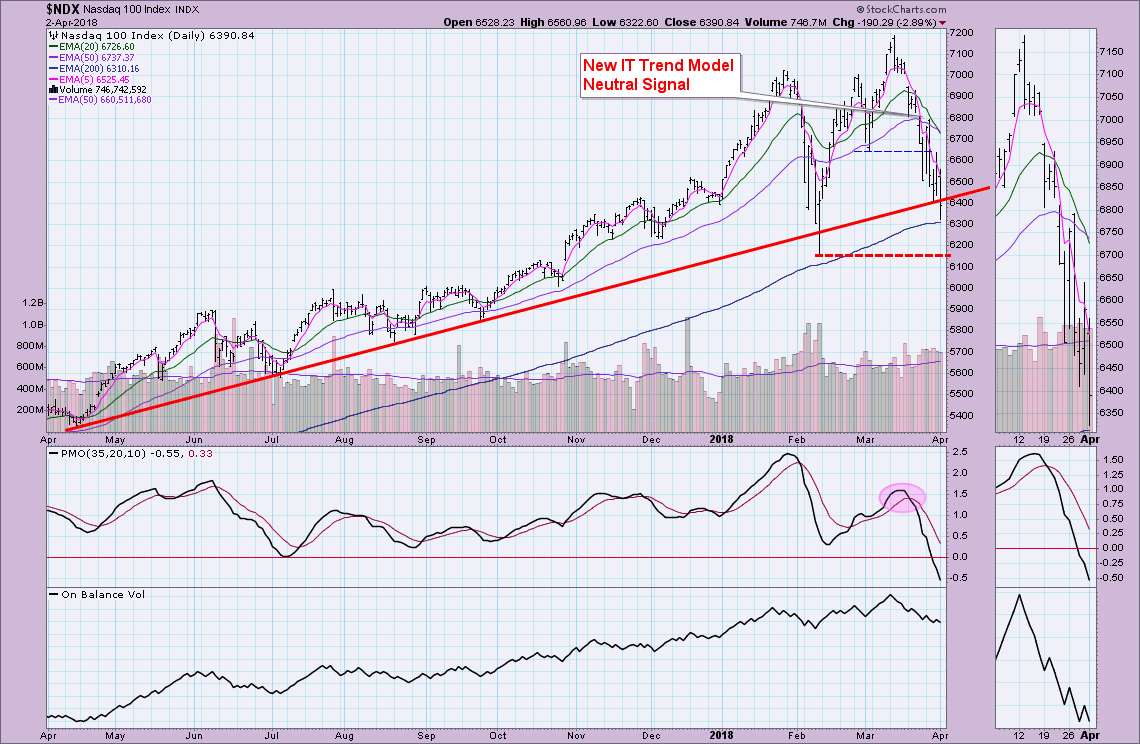
Today the NDX succumbed to peer pressure and dropped its Intermediate-Term Trend Model BUY signal. The Scoreboards below are clear: Long term has a bullish bias, but serious damage has been done in the short and intermediate terms.
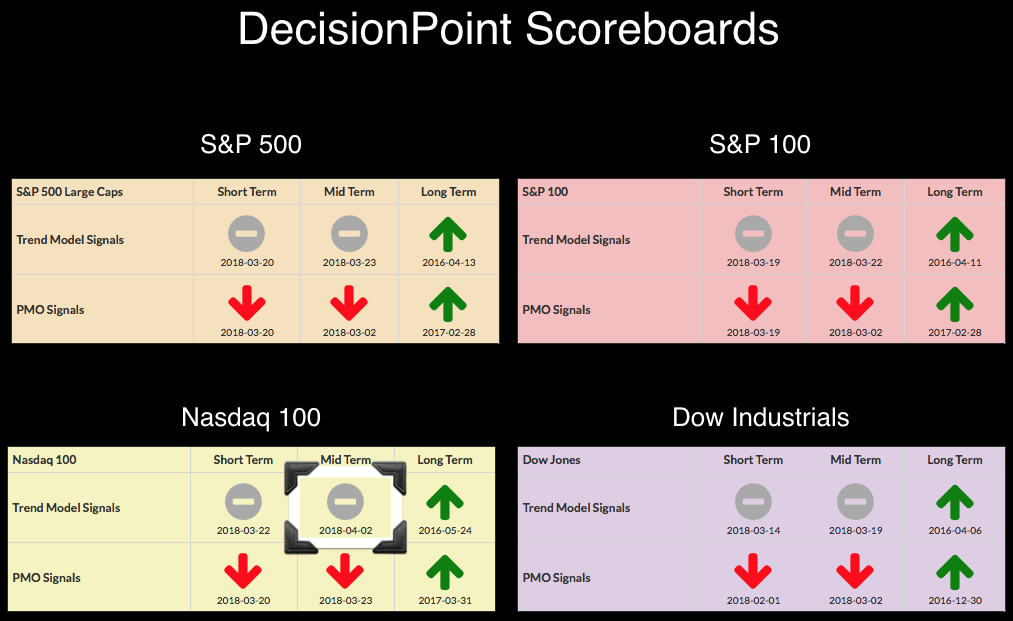
The IT Trend Model signals are based on 20/50-EMA crossovers in relation to the 200-EMA. Today the NDX 20-EMA crossed below the 50-EMA while the 50-EMA was above the 200-EMA. This is a Neutral signal. If the 50-EMA had been below the 200-EMA (bearish configuration), the 20/50-EMA negative crossover would've been a "SELL" signal. DecisionPoint considers the "neutral" signal as in cash or fully hedged. The intermediate-term rising bottoms trendline was broken today and price closed below. At this point, the NDX is clinging to support along the 200-EMA. Further support lies at 6150, but a breakdown below the 200-EMA would suggest to me this correction is dangerously close to spring loading a bear market.
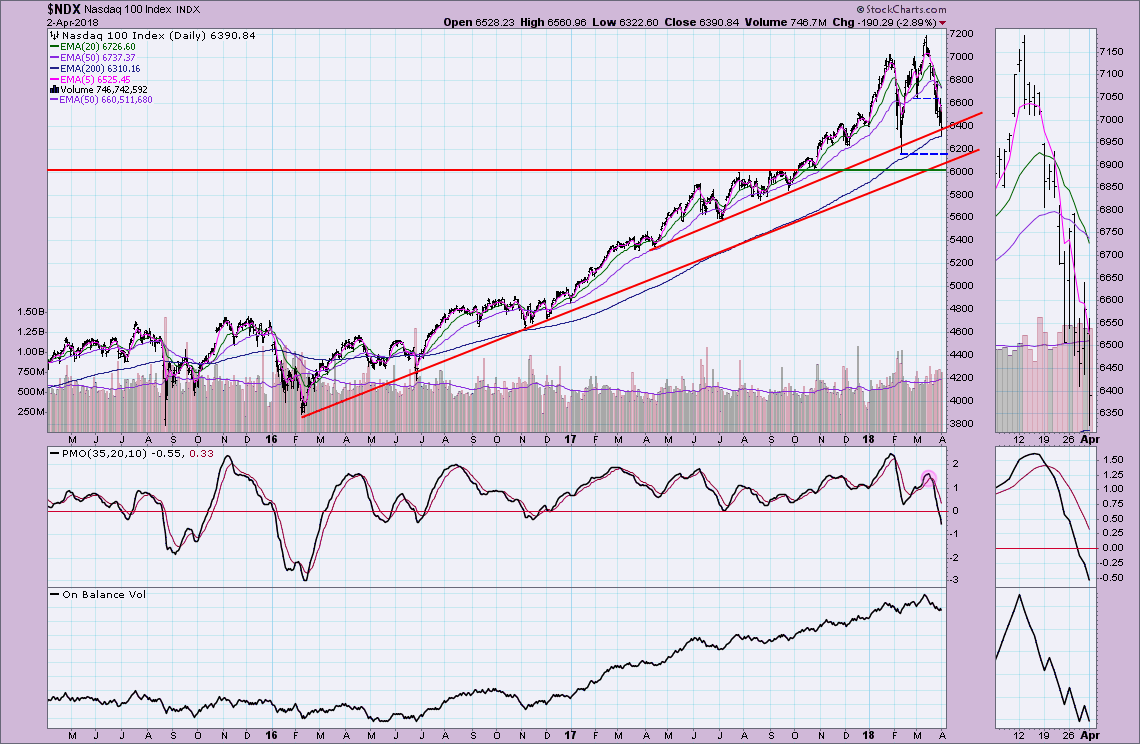
Below is a long-term daily chart. I've annotated a rising bottoms trendline from the 2016 low that does leave room for a possible turnaround point. It likely will coincide with horizontal support at the February 2017 low. I don't want to make excuses as to why this isn't a bear market yet, but we need to see more than just a test of the February low and a breakdown below 6200 would do that.
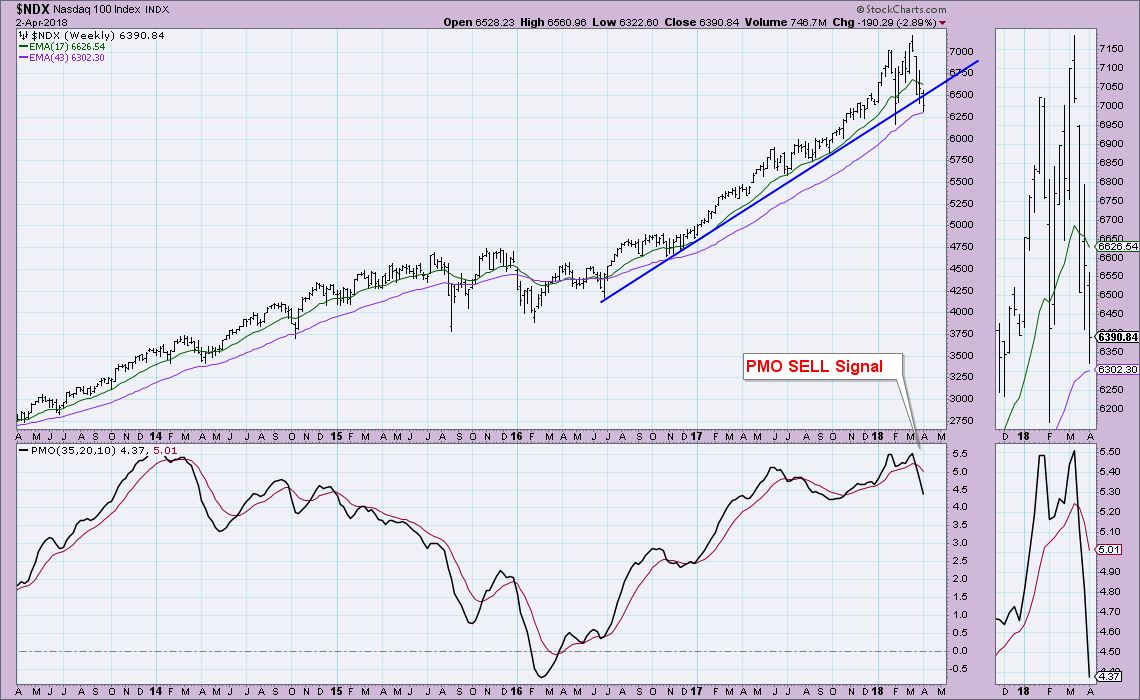
The intermediate-term PMO signal is derived from the weekly PMO. The sharp downward acceleration of the PMO is unnerving. We do see the 43-week EMA holding as support. If/when the PMO reading is below the previous bottom in 2017, as my kids say, "Things are gonna get real." We can only find so much price support and we are hanging on to it, barely.
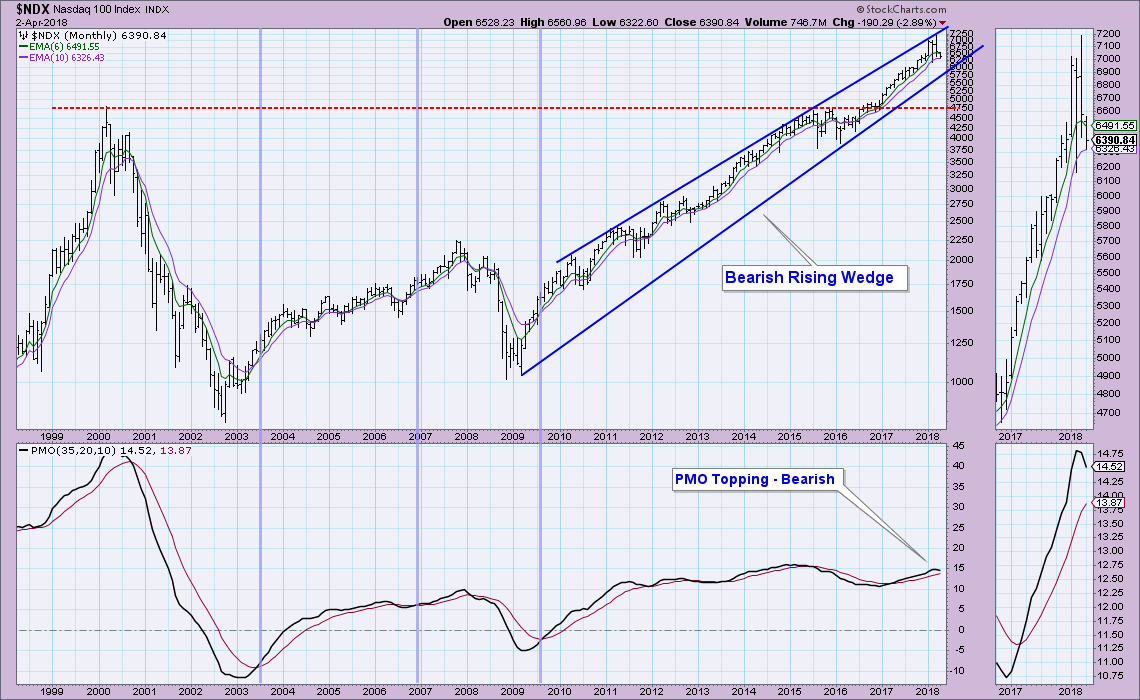
I've been watching the bearish rising wedge on the monthly chart. Most important is the rising bottoms trend line. Note that price could drop considerably and still hold the rising trend. Note the monthly PMO has turned down. This PMO top is slightly lower than the previous top and that is a negative divergence with price tops.
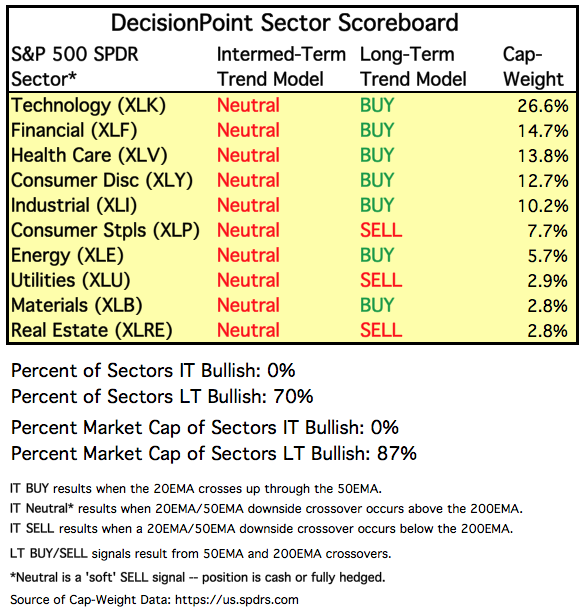
Carl forwarded me an updated sector summary table which is below. It's important to note that none of the sectors have an ITTM BUY signal. We will want to watch closely to see which sectors begin to strengthen. If we see defensive sectors like Consumer Staples or Health Care start to switch to BUY signals, that is a sure sign of a bear market. If money goes back into Discretionary/Cyclicals and Technology, then we can consider the correction is ending and the bull market is back on track.
Helpful DecisionPoint Links:
DecisionPoint Shared ChartList and DecisionPoint Chart Gallery
Price Momentum Oscillator (PMO)
Swenlin Trading Oscillators (STO-B and STO-V)
Technical Analysis is a windsock, not a crystal ball.
Happy Charting!
- Erin
**Don't miss DecisionPoint Commentary! Add your email below to be notified of new updates"**

