
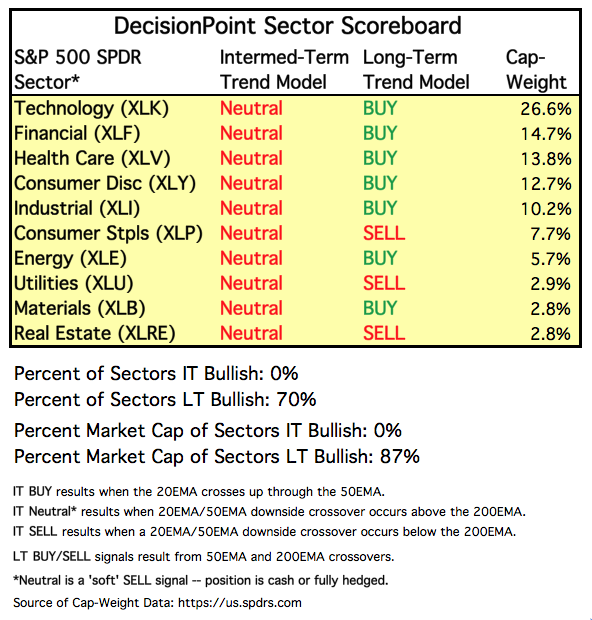
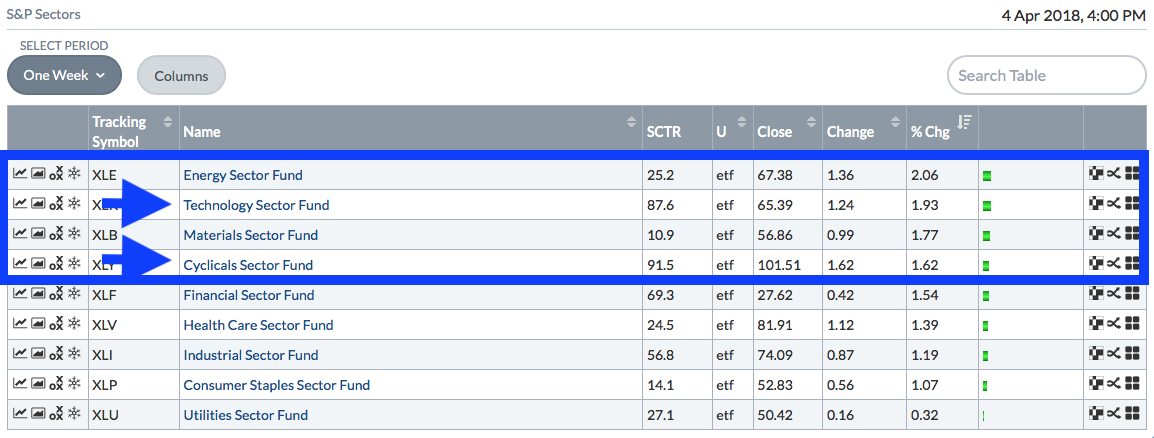
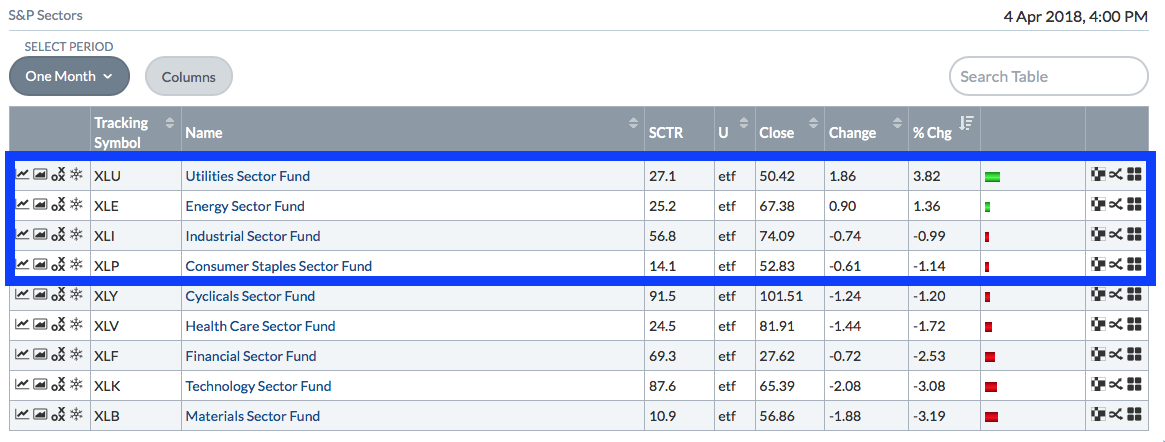
I was concerned earlier this week when we lost the IT Trend Model BUY signals in the aggressive technology and cyclicals sectors. However, both of these sectors have surged over the past two days which does allay fears of a bear market setting up. You'll see below the Sector Scoreboard, the one week and one month performance from the Sector Summary Report which shows you that over the past month defensive sectors were "leading" (some were just not losing as much as others) but now within the past week we see Technology and Consumer Discretionary coming back to life. I wrote an article about this last Thursday that I recommend you take a look at.
The purpose of the DecisionPoint Alert Daily Update is to quickly review the day's action, internal condition, and Trend Model status of the broad market (S&P 500), the nine SPDR Sectors, the U.S. Dollar, Gold, Crude Oil, and Bonds. To ensure that using this daily reference will be quick and painless, we are as brief as possible, and sometimes we let a chart speak for itself.
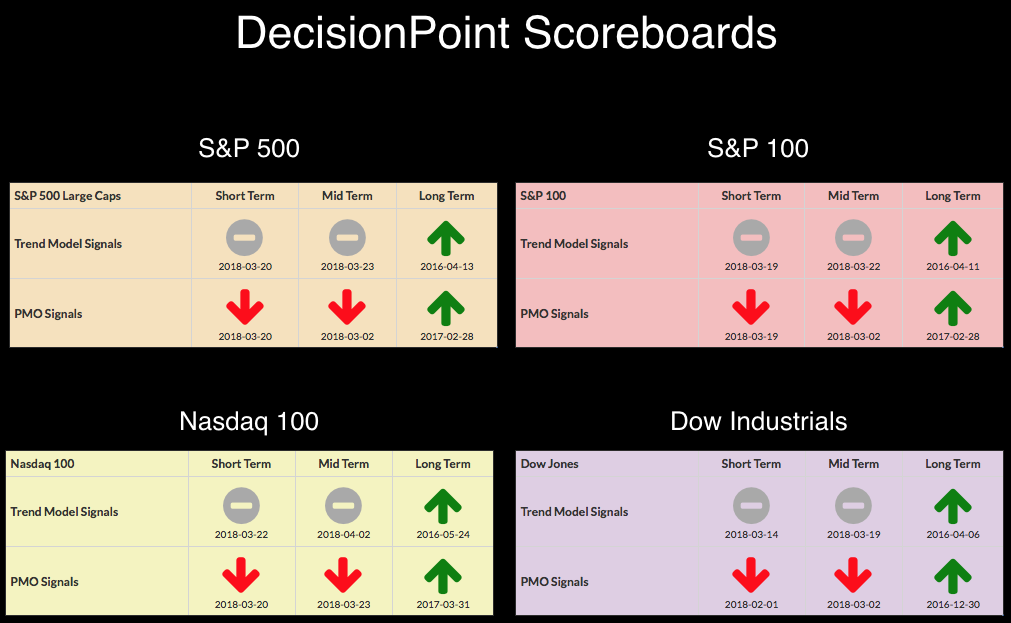
No changes on the DecisionPoint Scoreboards. The short and intermediate terms are showing weakness. The long-term signals are determined from 50/200-EMA crossovers and long-term PMO signals are based on the monthly PMO. With the strength of the bull market and parabolic rally we experienced, the 50-EMAs are well-above the 200-EMAs. We're only now seeing 200-EMA support challenged. A negative crossover can only occur with lengthly trading below the 200-EMA...not a likely scenario. Monthly PMOs have topped, but they are very slow moving and likely won't have negative crossovers until a bear market has established itself.
STOCKS
IT Trend Model: Neutral as of 3/23/2018
LT Trend Model: BUY as of 4/1/2016
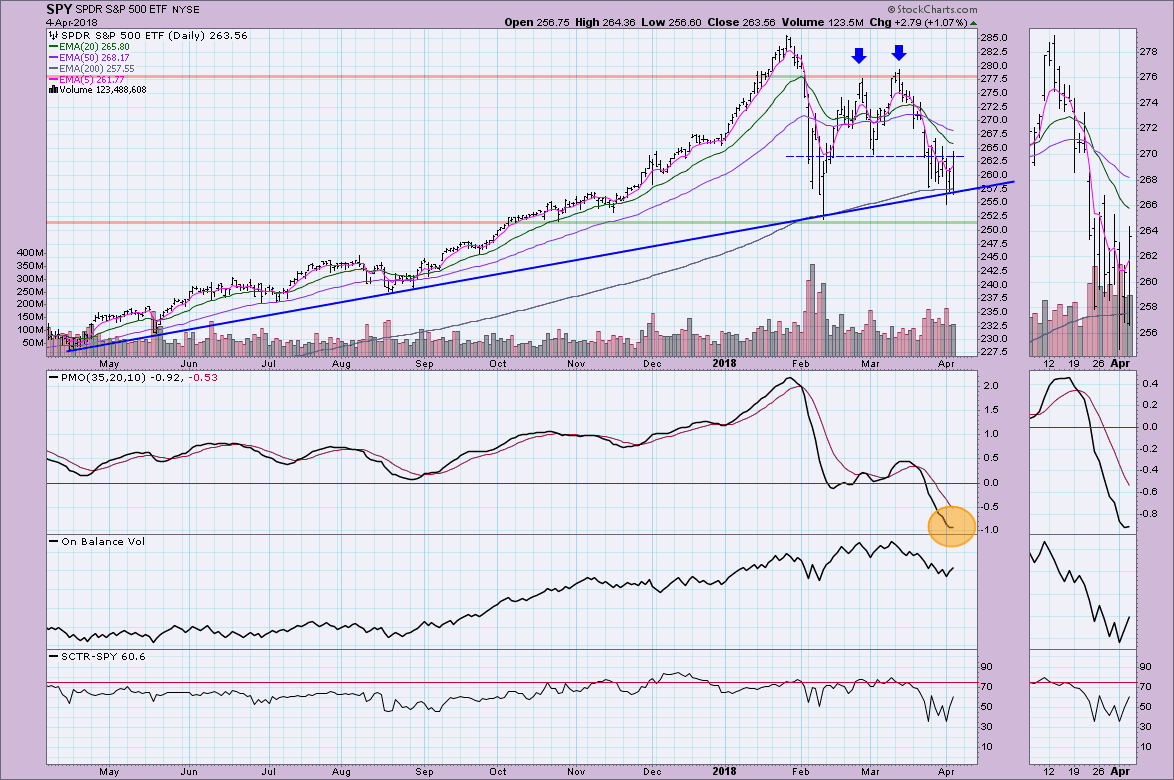
I've been saying on the MarketWatchers LIVE show and in my blogs that if we are to avoid a bear market, we need to see a rally now. We have very strong support along the 200-EMA and rising bottoms trendline. The test of the February low seems to be in. The PMO bottomed today.
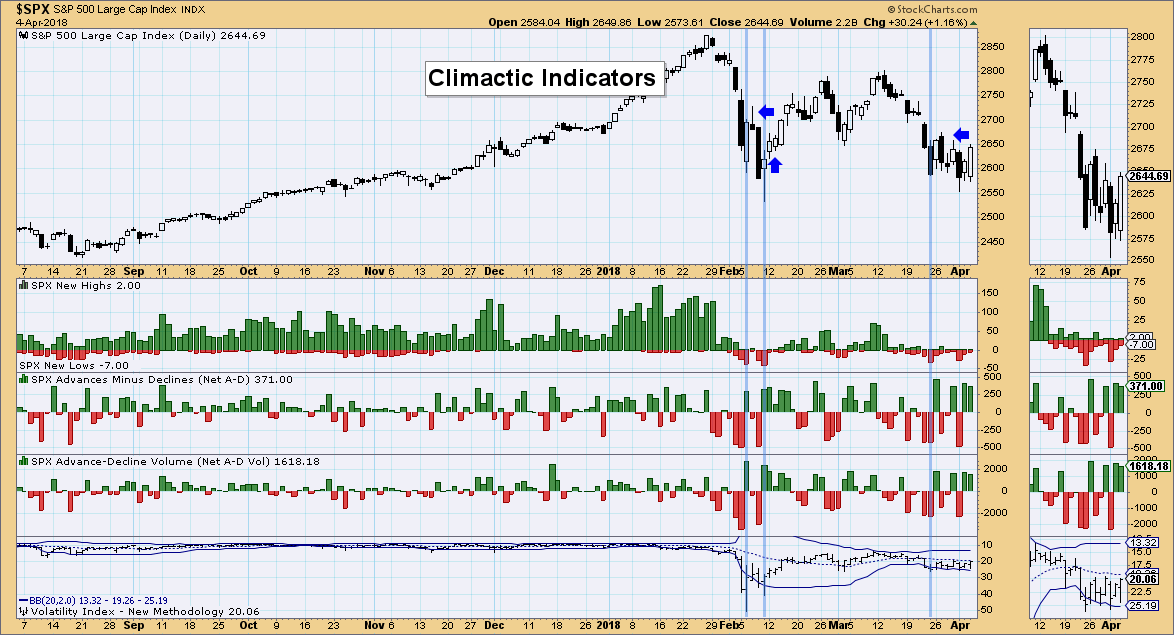
Climactic Indicators:
We saw very positive climactic readings on breadth the past two days which suggests an initiation of a rally. The VIX isn't helpful sitting on its moving average and not challenging the upper or lower Bollinger Bands.
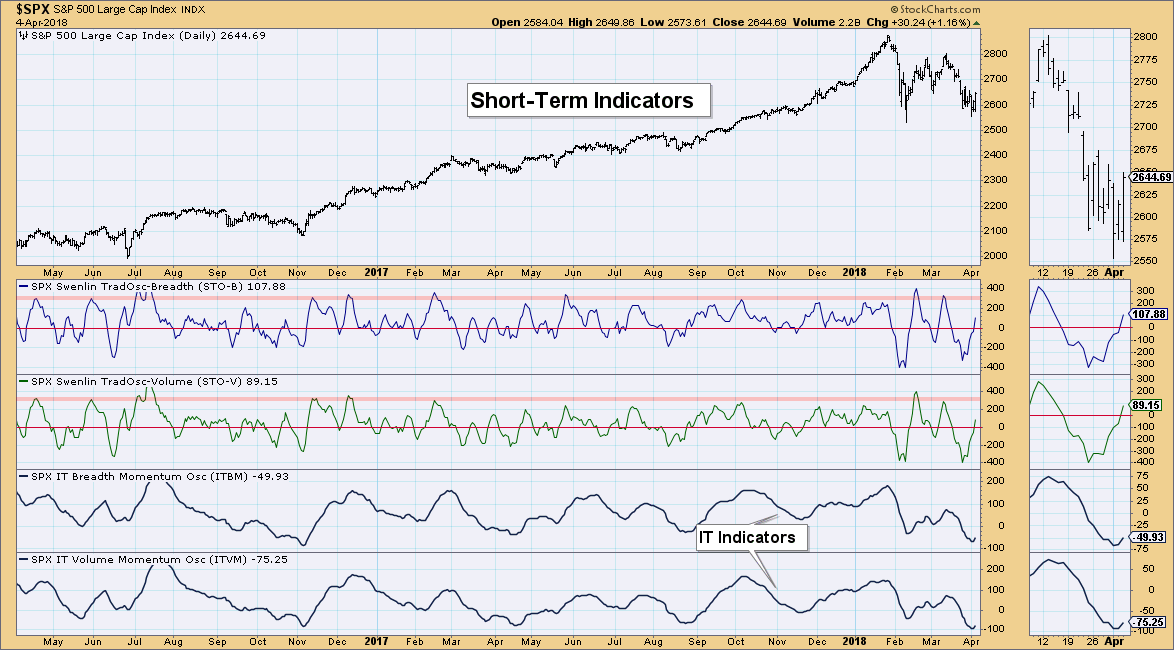
Short-Term Indicators:
These indicators have soared out of oversold territory and still have some room to move higher which is positive.
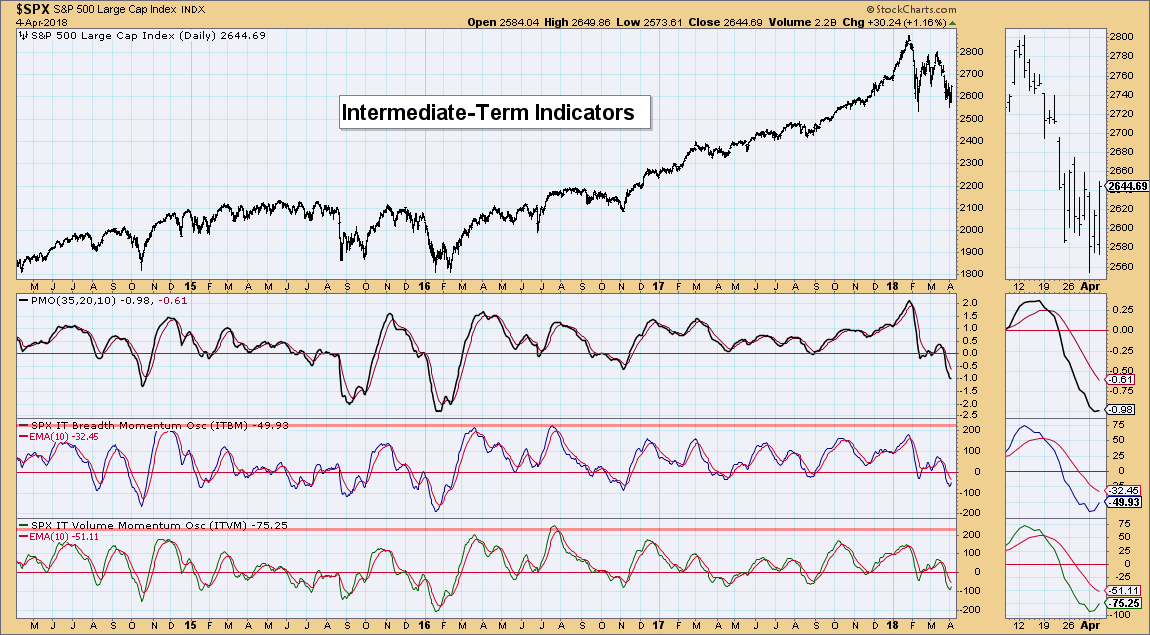
Intermediate-Term Indicators:
I'm happy to see these rising, but I'll feel much better when they have a positive crossover. This is encouraging though.
Conclusion:
I've been on the fence about the beginning of a bear market and admittedly I was starting to see possible signs of a bear market with sector rotation and failed support. However, we're getting the rally where we need it and it comes on a surge from aggressive sectors like technology and consumer discretionary. At the very least we are seeing a short-term rally that could launch prices to new all-time highs. I remain cautious in the intermediate term until I see the IT indicators have positive crossovers.
DOLLAR
IT Trend Model: SELL as of 12/21/2017
LT Trend Model: SELL as of 05/24/2017
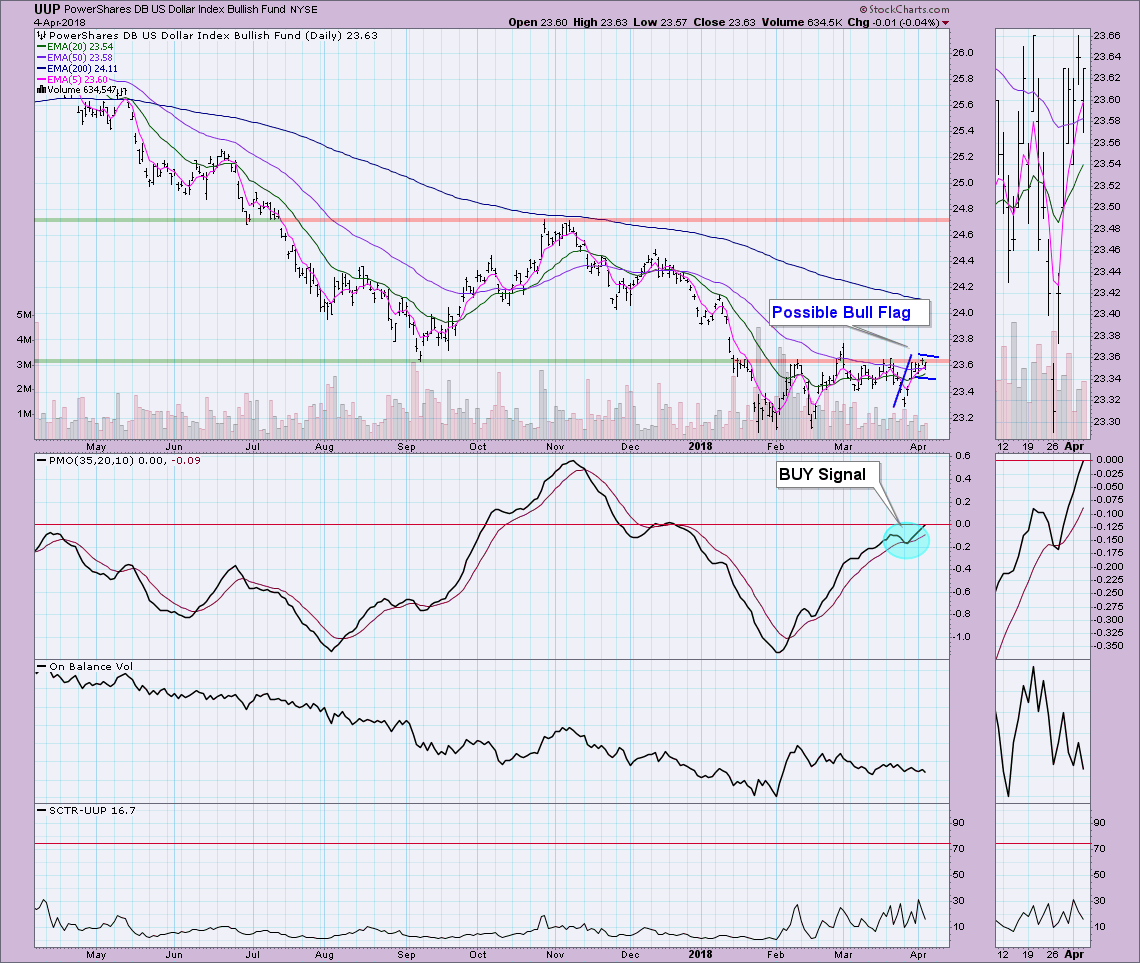
I shake my head at the Dollar everyday. It is so overdue for a breakout but is refusing to. The PMO has bee rising nicely since mid-February, but it hasn't bought much in the way of price movement to the upside. The indicators are still very positive and you can make a case for a short-term bull flag. I'll continue to wait patiently for a breakout.
GOLD
IT Trend Model: BUY as of 1/2/2018
LT Trend Model: BUY as of 4/12/2017
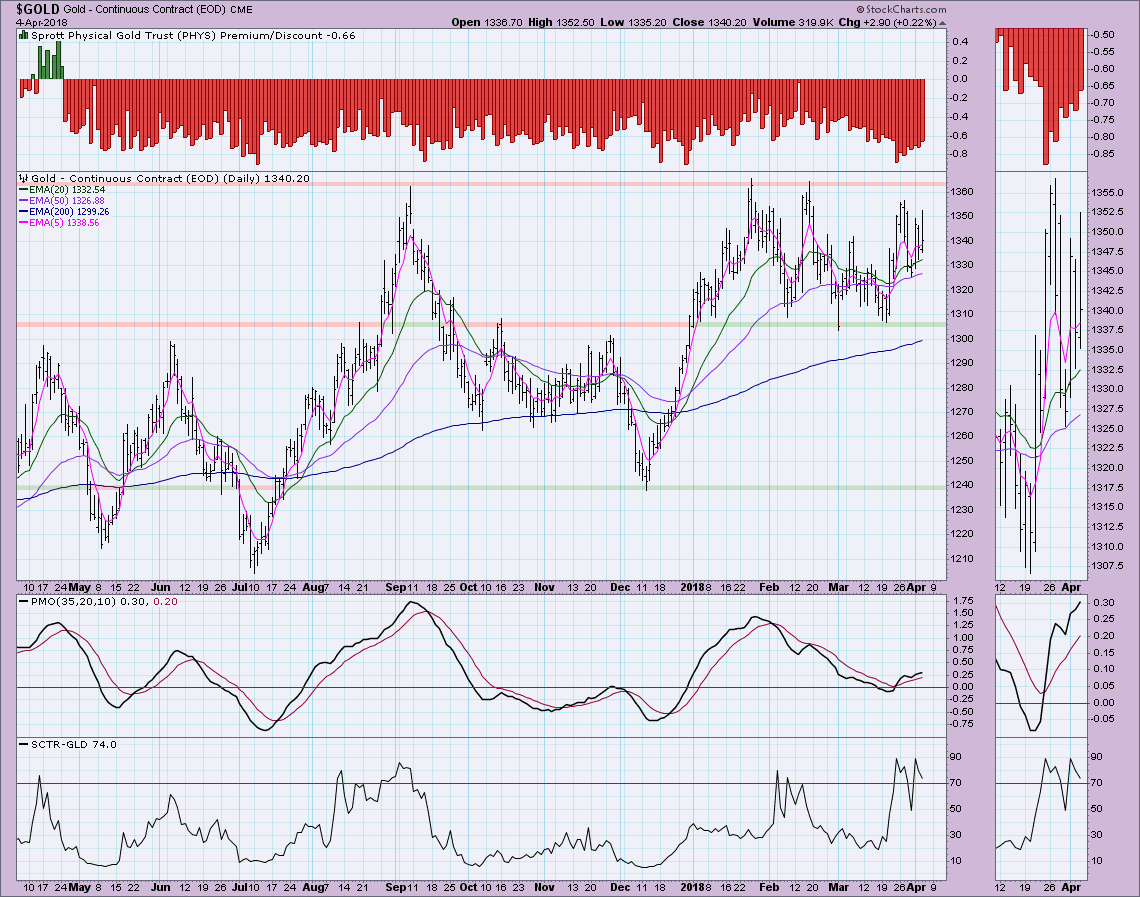
Gold has seen some whipsaw. I would've expected to see it perform better during the recent decline. I suspect we're stuck in a trading range. I'm looking for Gold to test overhead resistance given the positive configuration of the PMO.
CRUDE OIL (USO)
IT Trend Model: BUY as of 9/7/2017
LT Trend Model: BUY as of 11/2/2017
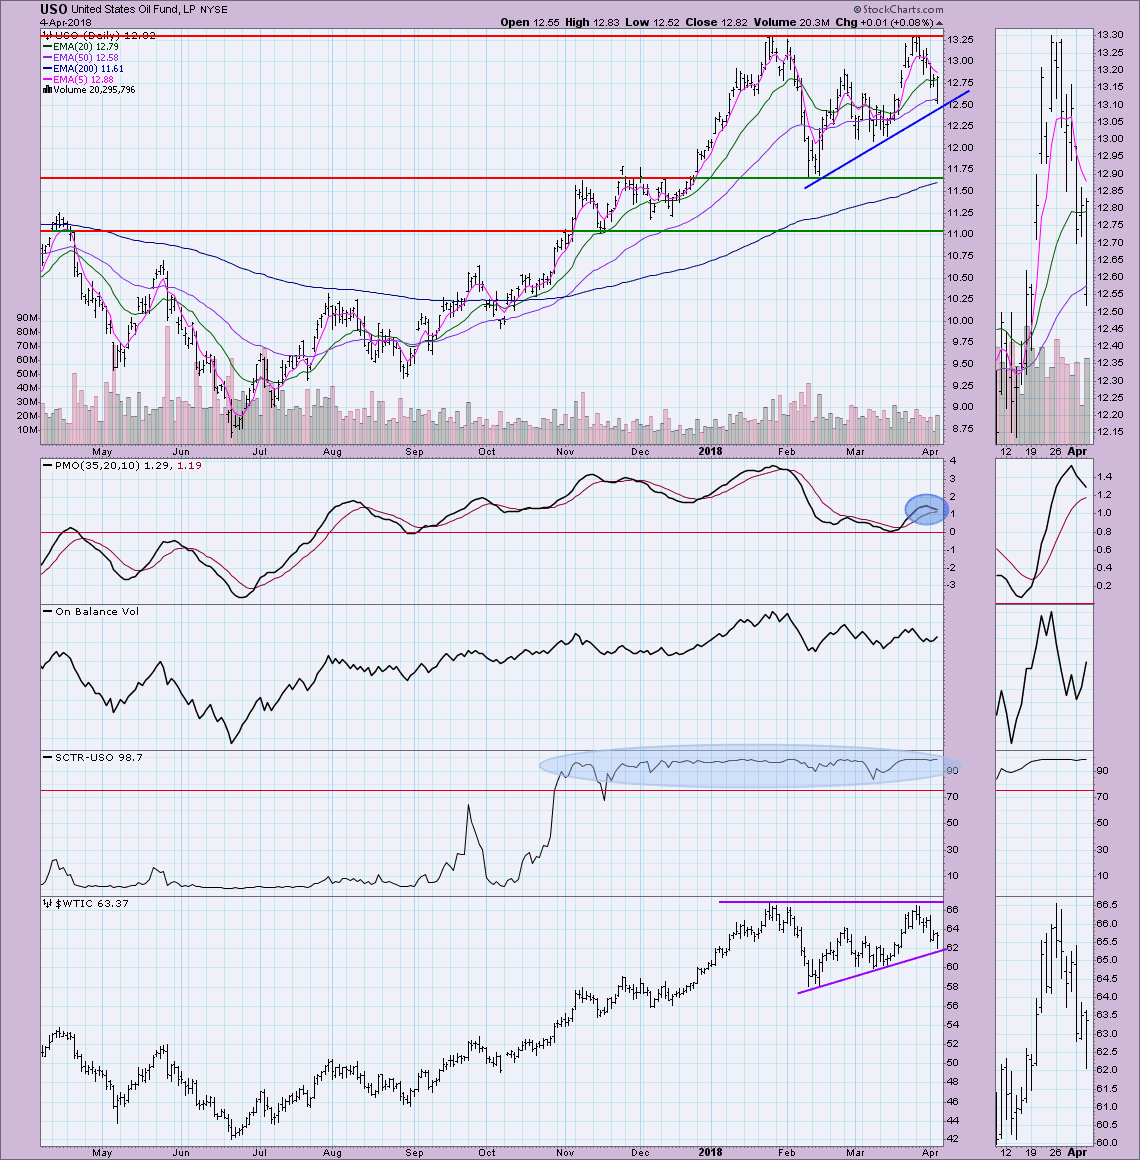
The Ascending Triangle visible on $WTIC suggests a breakout above $13.25 is upcoming. However, the PMO has turned down so I would watch support along the rising bottoms trendline.
BONDS (TLT)
IT Trend Model: Neutral as of 1/11/2018
LT Trend Model: SELL as of 2/8/2018
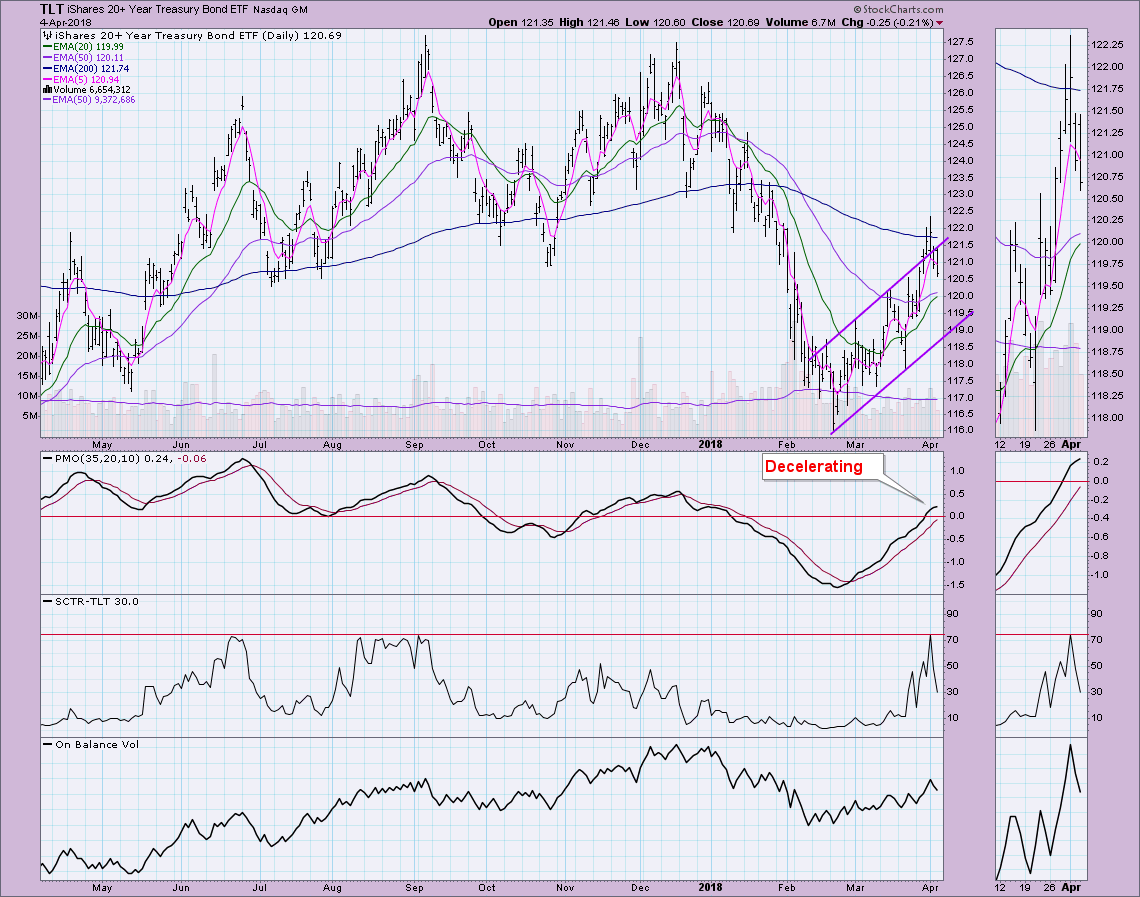
TLT remains in a rising trend. I didn't annotate it, but we are seeing a bit of a parabolic move from the February low that pushed price above the trend channel. Given the decelerating PMO, I would expect it is time for price to test the bottom of the rising trend channel.
DecisionPoint Shared ChartList and DecisionPoint Chart Gallery
Price Momentum Oscillator (PMO)
Swenlin Trading Oscillators (STO-B and STO-V)
Technical Analysis is a windsock, not a crystal ball.
Happy Charting!
- Erin

