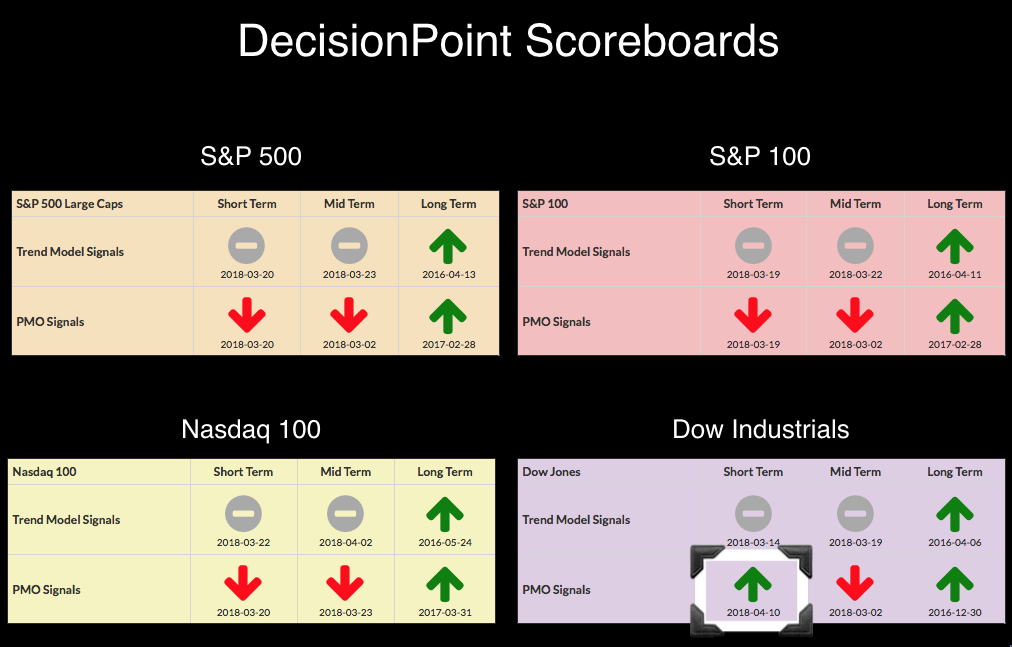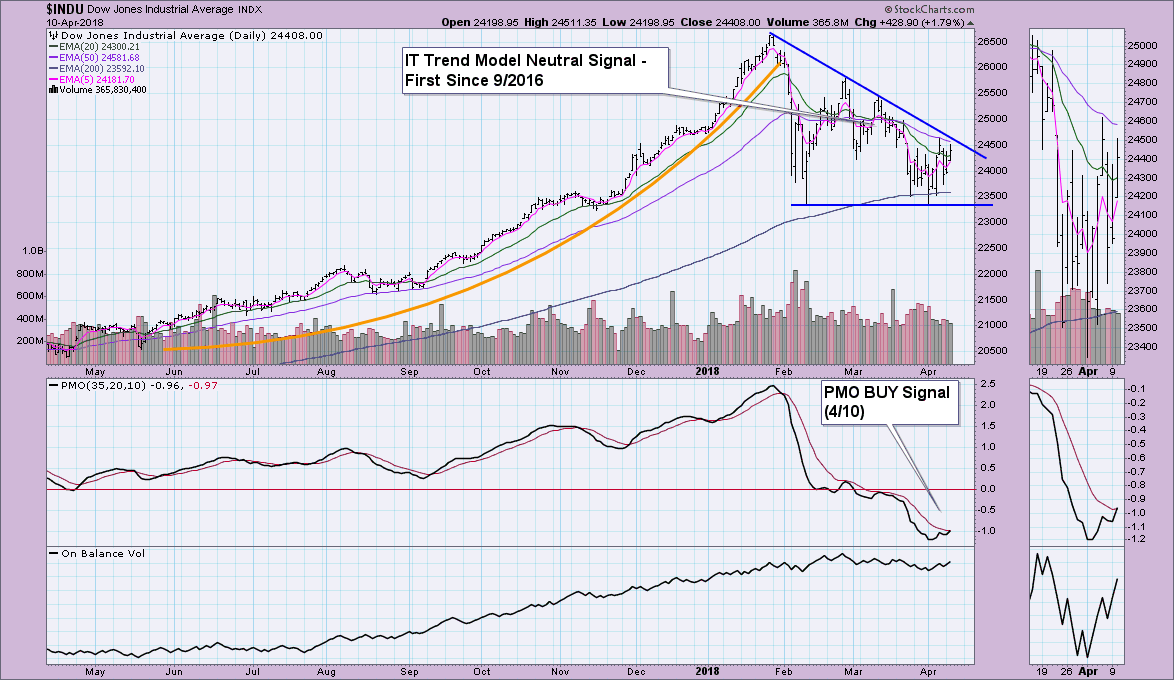
The Dow is the first to shed it's previous Price Momentum Oscillator (PMO) SELL signal. The SELL signal had been in place since 2/2/18. Found it interesting that the earliest PMO SELL signal on the DP Scoreboards managed to move to a BUY signal before all of the more recent March PMO SELL signals on the OEX, SPX and NDX. However, if you look at the charts, you'll see that the SPX and OEX whipsawed their PMO signals which moved the date up. The NDX just took longer given the strong positive momentum it had during the parabolic rally.

The PMO BUY signal was triggered when the PMO crossed above its signal line. The chart pattern looks like a descending triangle, but I hesitate to name it as such given all the "white space" between to the two lows which is one reason we often look for at least three lows to connect the support/base of the descending triangle. I'm more interested in the declining tops trend line. I believe a breakout here would at least signal a short-term rally to challenge the February/March tops. OBV is improving; note in the thumbnail the rising bottoms that are in line with rising price bottoms. We can see the PMO has been very 'twitchy' during this volatile correction which is why I'm not getting too bullish here; the PMO wouldn't have any problem whipsawing back to a SELL signal.
Conclusion: While this is very positive for the market, we should consider that this BUY signal may not hold up too long.
Helpful DecisionPoint Links:
DecisionPoint Shared ChartList and DecisionPoint Chart Gallery
Price Momentum Oscillator (PMO)
Swenlin Trading Oscillators (STO-B and STO-V)
Technical Analysis is a windsock, not a crystal ball.
Happy Charting!
- Erin
**Don't miss DecisionPoint Commentary! Add your email below to be notified of new updates"**

