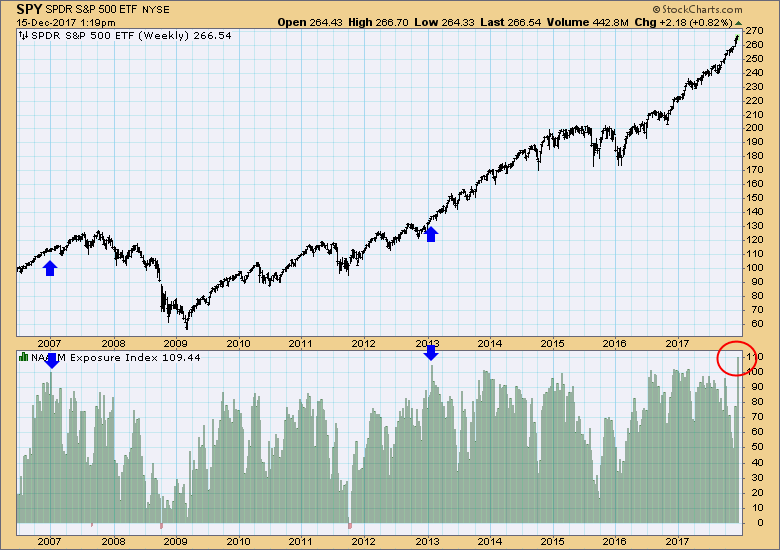
This week the National Association of Active Investment Managers (NAAIM) Exposure Index reached the highest reading since its inception in 2006. Rather than stay 100% invested, NAAIM members will raise or lower their fund's market exposure based upon their assumptions regarding future market action. The potential range of the Index is +200% to -200%, but historically it has ranged from slightly below zero to around +100%. This week it hit +109.4%, and as a sentiment indicator I'm wondering how we should interpret it.
Looking at previous performance, there is no consistency of price action following high readings. We can dig around and find Index peaks that coincide with price tops, particularly in bear markets, but I think generally speaking high readings tend to be weeks/months early relative to intermediate-term market tops. That said, this peak makes me nervous. The market has been in a vertical ascent since the middle of last quarter, and this high Exposure Index reading could be a precursor to a long-overdue correction -- to happen sooner rather than later.
One thing to remember about sentiment polls, people in the group being polled are normally responding rationally to market action. Market goes up, they get bullish, and vice versa. Even at extremes, they are not always wrong.
The DecisionPoint Weekly Wrap presents an end-of-week assessment of the trend and condition of the stock market (S&P 500), the U.S. Dollar, Gold, Crude Oil, and Bonds.
STOCKS
IT Trend Model: BUY as of 11/15/2016
LT Trend Model: BUY as of 4/1/2016
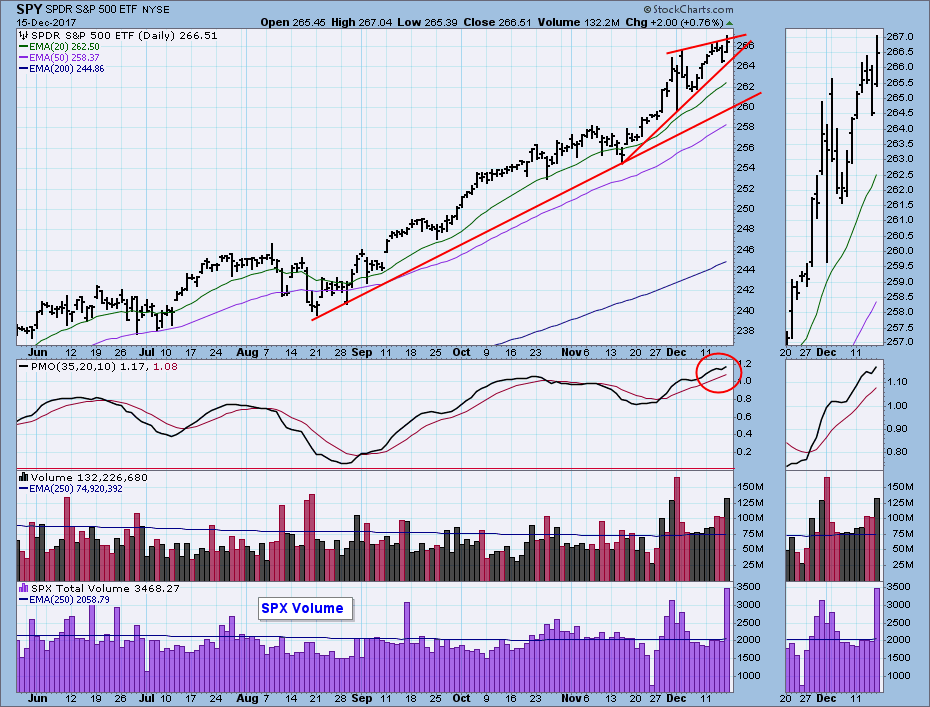
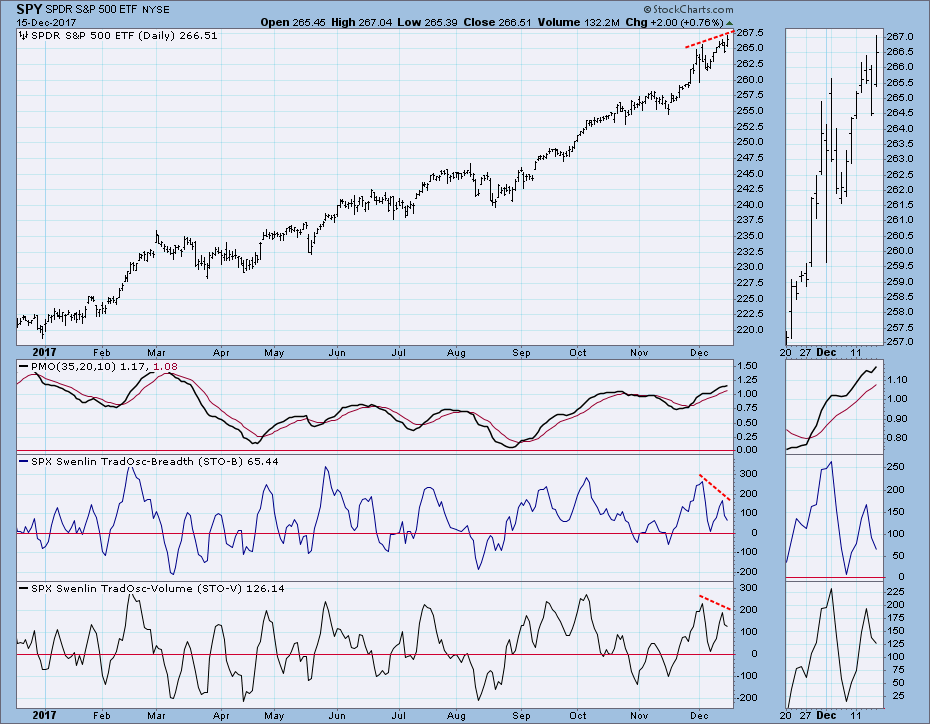
Daily Chart: Another whacky week with a short-term top on Wednesday followed by new, all-time highs on Friday. Higher than normal volume on Friday can be attributed to options expiration. There may also be a climax component in there, but there is no way to tell. (See our discussion of Climactic Indicators below.) The rising trend line drawn from the November low is quite steep, and a rising wedge has been formed. As usual, my expectation is that the wedge will resolve downward.
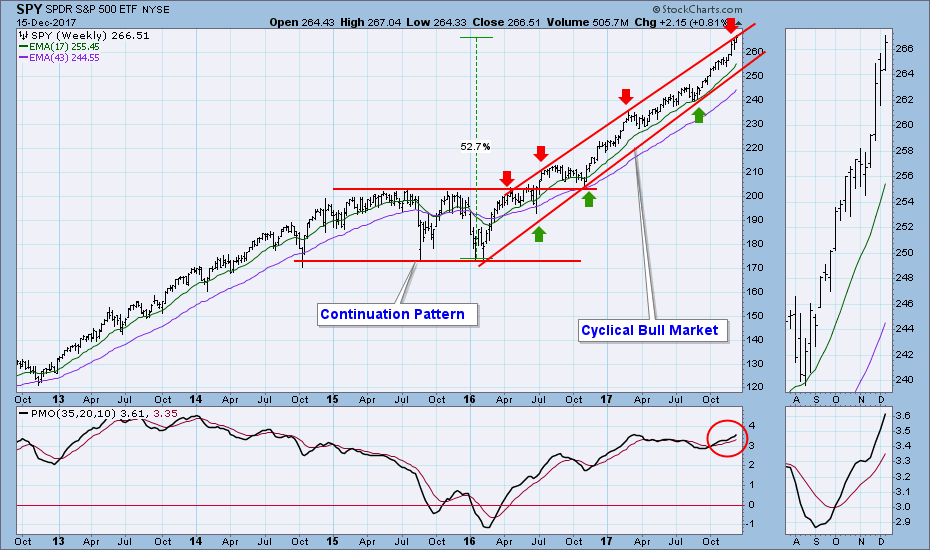
Weekly Chart: Price remains at the top of the long-term rising trend channel. The market may hug that line through the end of the year. The weekly PMO is overbought and rising.
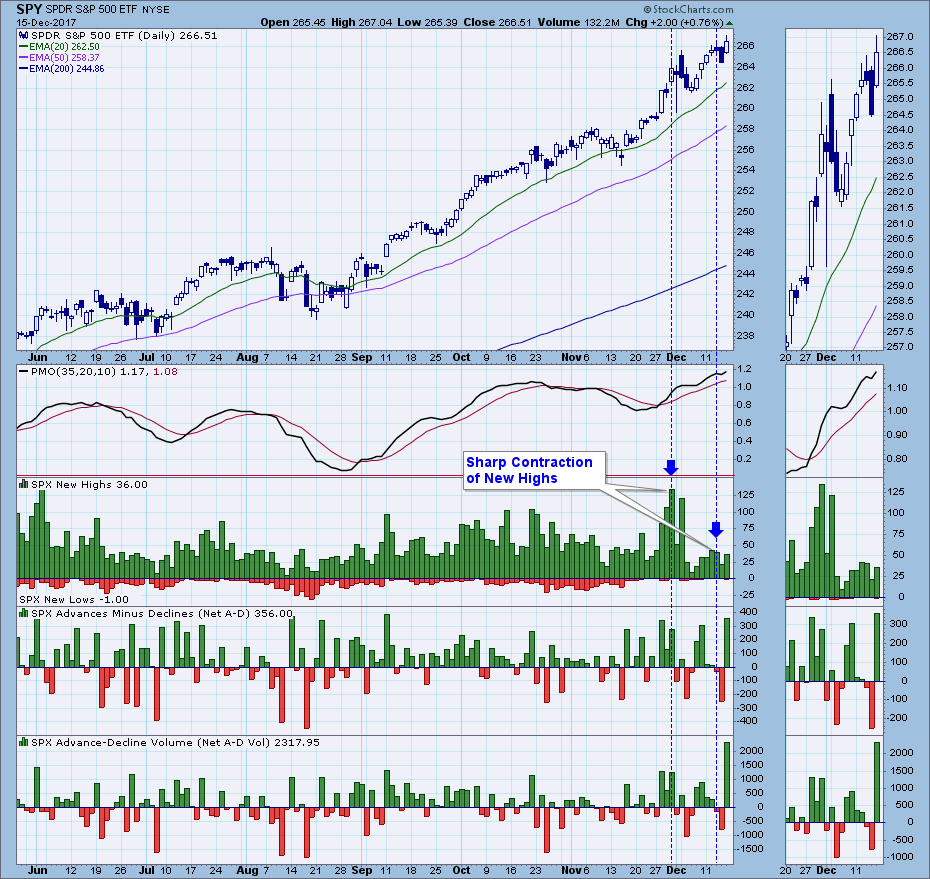
Climactic Market Indicators: This chart is predicting some short-term turbulence. New Highs climaxed at a pretty high number at the end of last month. In comparison, as price moved to record highs this week, New Highs contracted significantly. This means that fewer stocks were participating in that record push -- a negative divergence. Net breadth and volume climaxed up on Friday.
Short-Term Market Indicators: Negative divergences stand out on this chart.
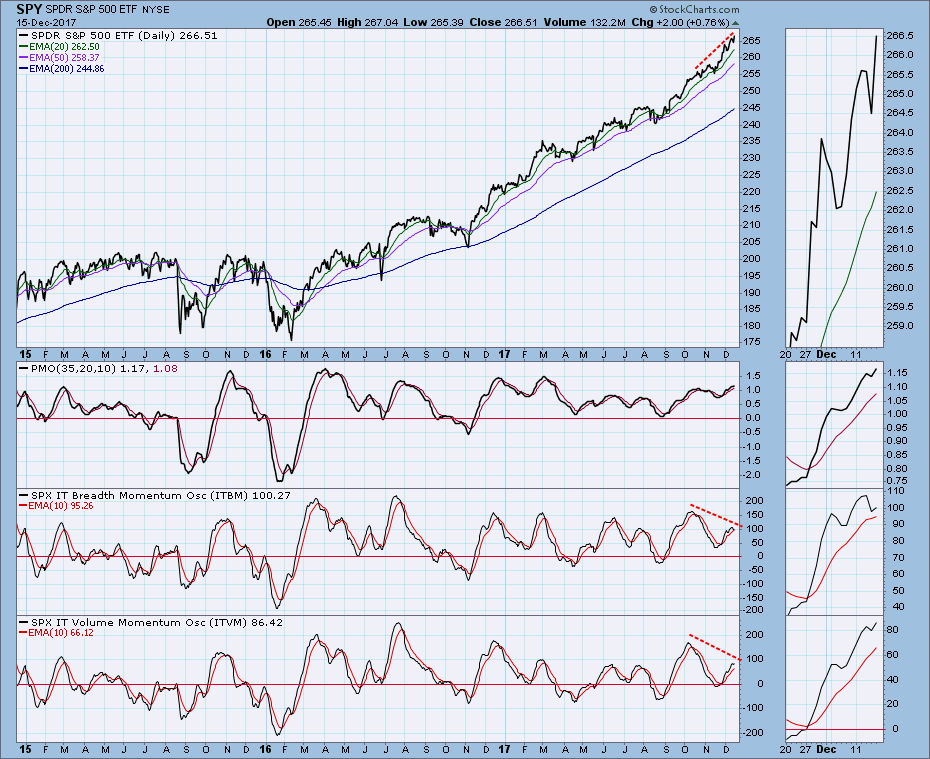
Intermediate-Term Market Indicators: Negative divergences are also notable in this time frame. Friday's strong upward push did turn these indicators up again.
Conclusion: There are two significant issues this week: (1) SPY has hit overhead resistance on the weekly chart, and (2) the contraction of New Highs discussed above on the Climactic Indicators chart. I think these issues will have only short-term impact at this point for the simple reason that the market just doesn't want to go down. We could run into some turbulence next week, but my expectation continues to be for the market to continue higher into the end of the year.
DOLLAR (UUP)
IT Trend Model: BUY as of 12/12/2017
LT Trend Model: SELL as of 5/24/2017
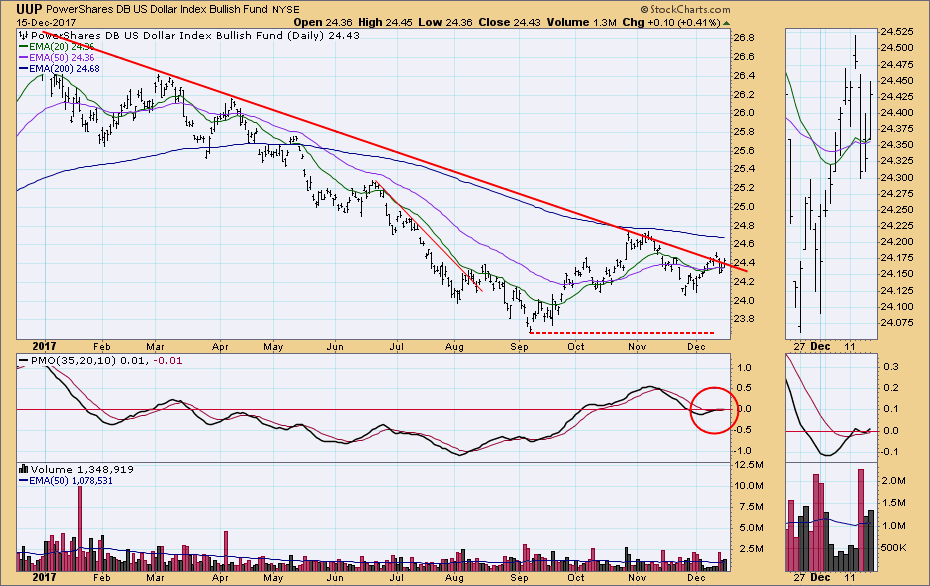
Daily Chart: This week UUP generated a new IT Trend Model BUY signal, when the 20EMA crossed up through the 50EMA, but price still hasn't overcome the resistance of the declining tops line.
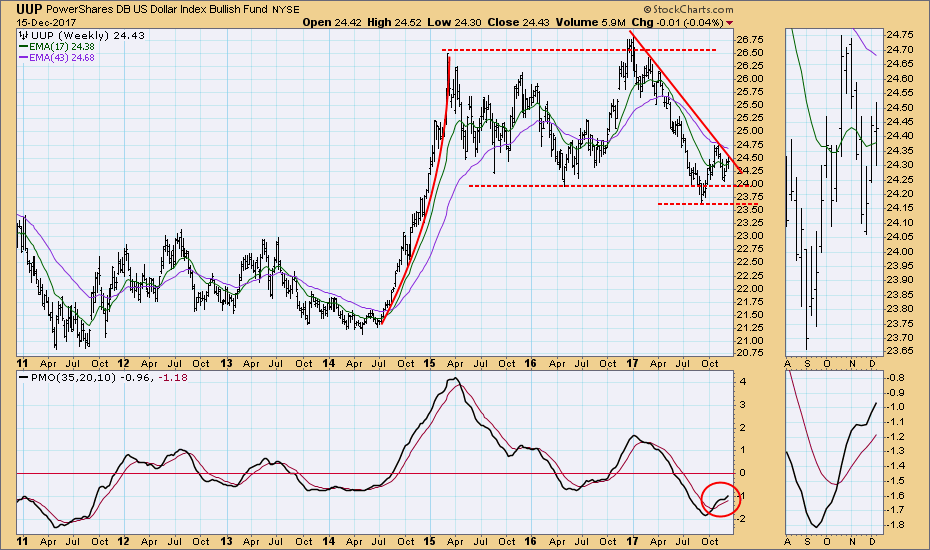
Weekly Chart: The bullish weekly PMO implies that UUP is going to break above the declining tops line.
GOLD
IT Trend Model: NEUTRAL as of 10/20/2017
LT Trend Model: BUY as of 4/12/2017
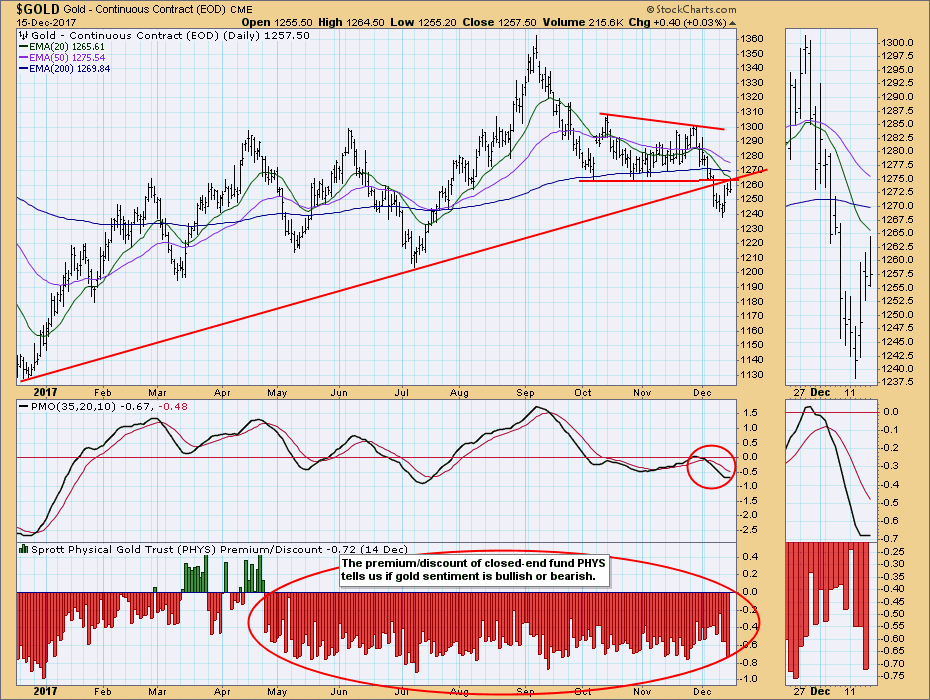
Daily Chart: Gold broke down from the one-year rising trend line last week, and this week price snapped back to that point of breakdown. The PMO is trying to bottom, but I don't think it is going to make it.
Weekly Chart: A rising trend line has been broken, but there is long-term support in the area of 1200.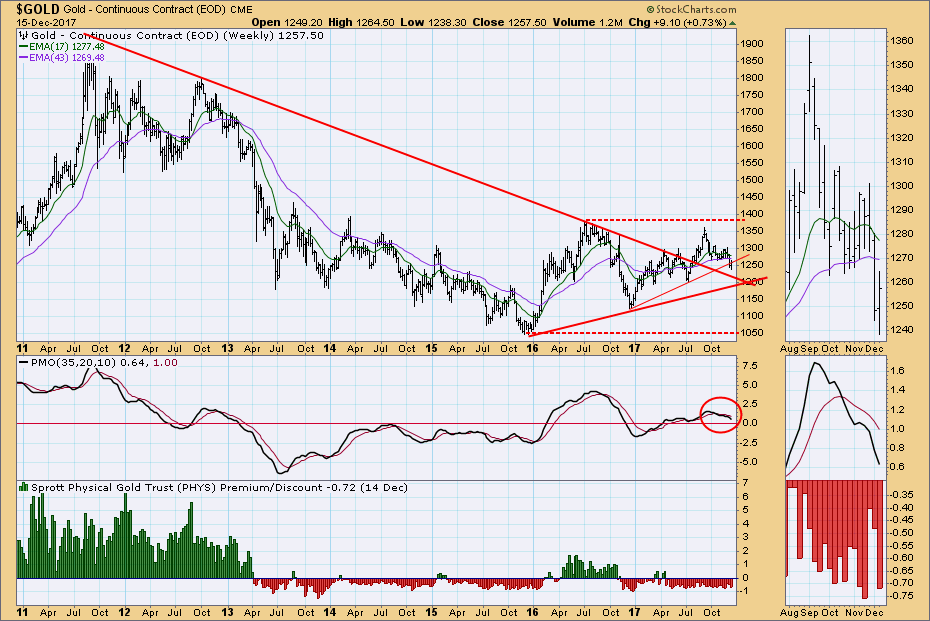
CRUDE OIL (USO)
IT Trend Model: BUY as of 9/6/2017
LT Trend Model: BUY as of 11/2/2017
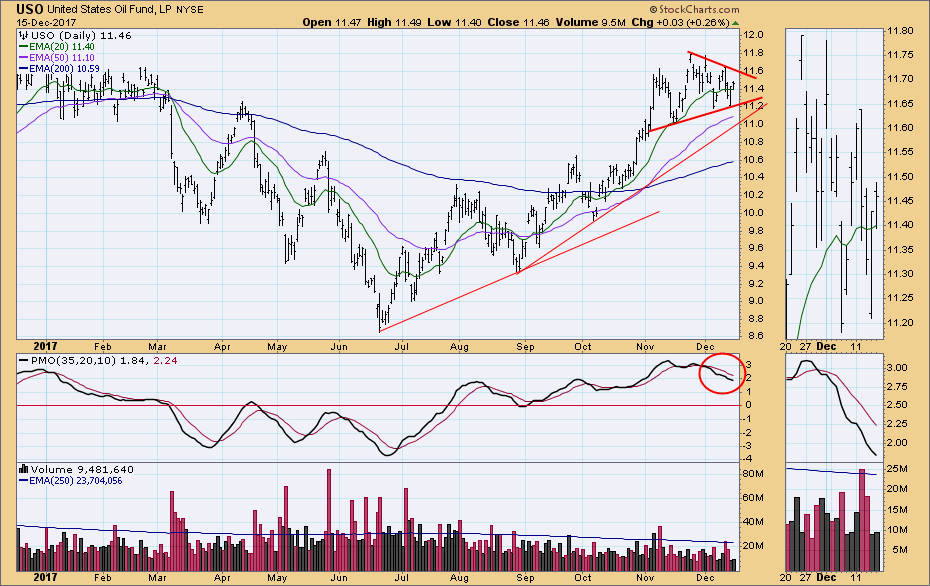
Daily Chart: A triangle has formed, and it may be a top or a continuation pattern. The daily PMO is falling from overbought levels.
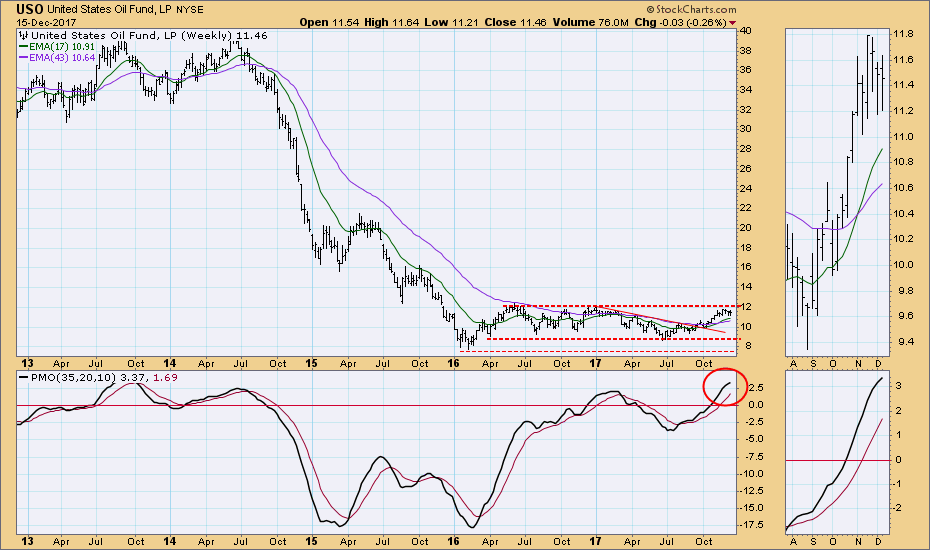
Weekly Chart: USO has been stalled just below the top of the 22-month trading channel, and the daily PMO is overbought and decelerating. My impression is that a top is forming.
BONDS (TLT)
IT Trend Model: BUY as of 11/8/2017
LT Trend Model: BUY as of 6/16/2017
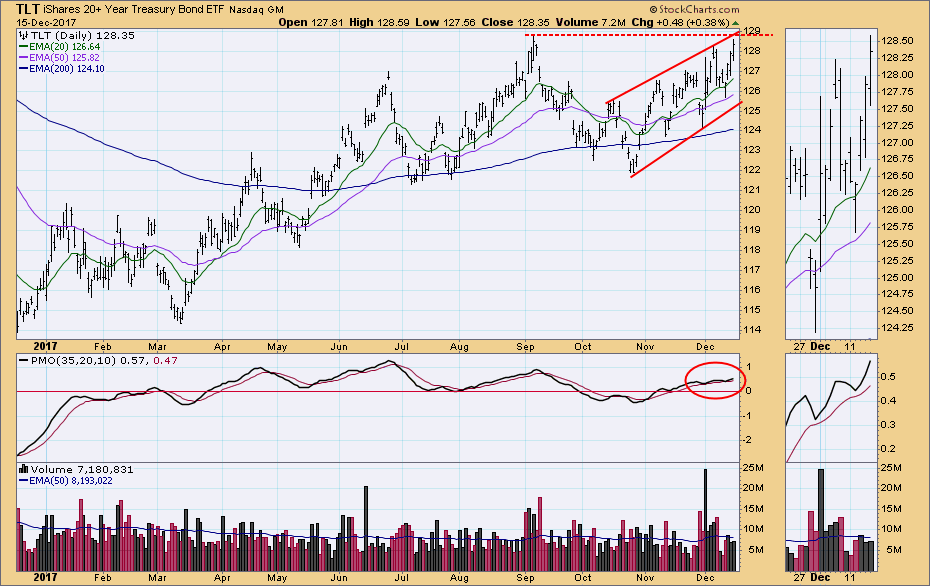
Daily Chart: Price is reaching combined overhead resistance from the rising tops line and horizontal resistance drawn from the September top. The daily PMO is above the signal line and rising, but it is a very shallow angle of ascent.
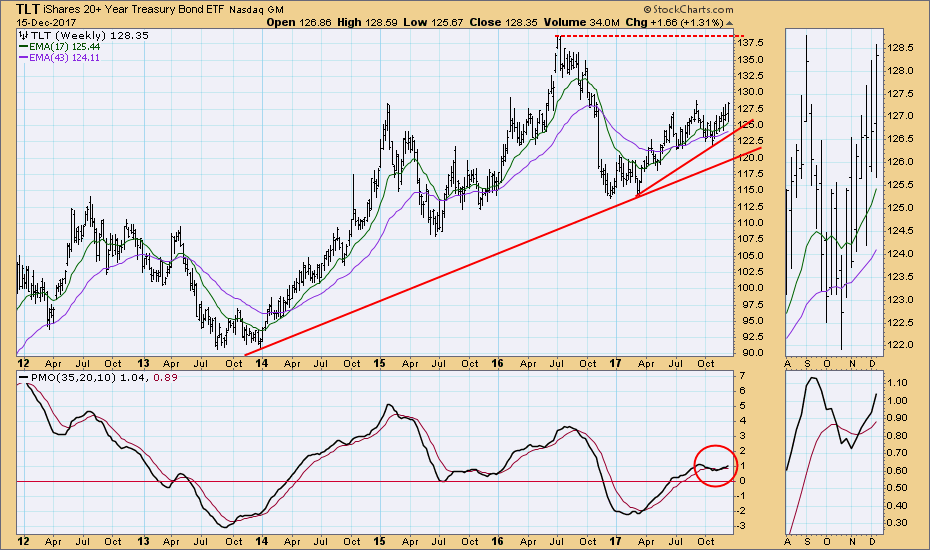
Weekly Chart: I have been monitoring a possible head and shoulders pattern across the last three tops of this year, but I am giving up on it -- the right shoulder has gotten a little too high.
**Don't miss any of the DecisionPoint commentaries! Go to the "Notify Me" box toward the end of this blog page to be notified as soon as they are published.**
Technical Analysis is a windsock, not a crystal ball.
Happy Charting!
- Carl
NOTE: The signal status reported herein is based upon mechanical trading model signals, specifically, the DecisionPoint Trend Model. They define the implied bias of the price index based upon moving average relationships, but they do not necessarily call for a specific action. They are information flags that should prompt chart review. Further, they do not call for continuous buying or selling during the life of the signal. For example, a BUY signal will probably (but not necessarily) return the best results if action is taken soon after the signal is generated. Additional opportunities for buying may be found as price zigzags higher, but the trader must look for optimum entry points. Conversely, exit points to preserve gains (or minimize losses) may be evident before the model mechanically closes the signal.
Helpful DecisionPoint Links:
DecisionPoint Shared ChartList and DecisionPoint Chart Gallery
Price Momentum Oscillator (PMO)
Swenlin Trading Oscillators (STO-B and STO-V)

