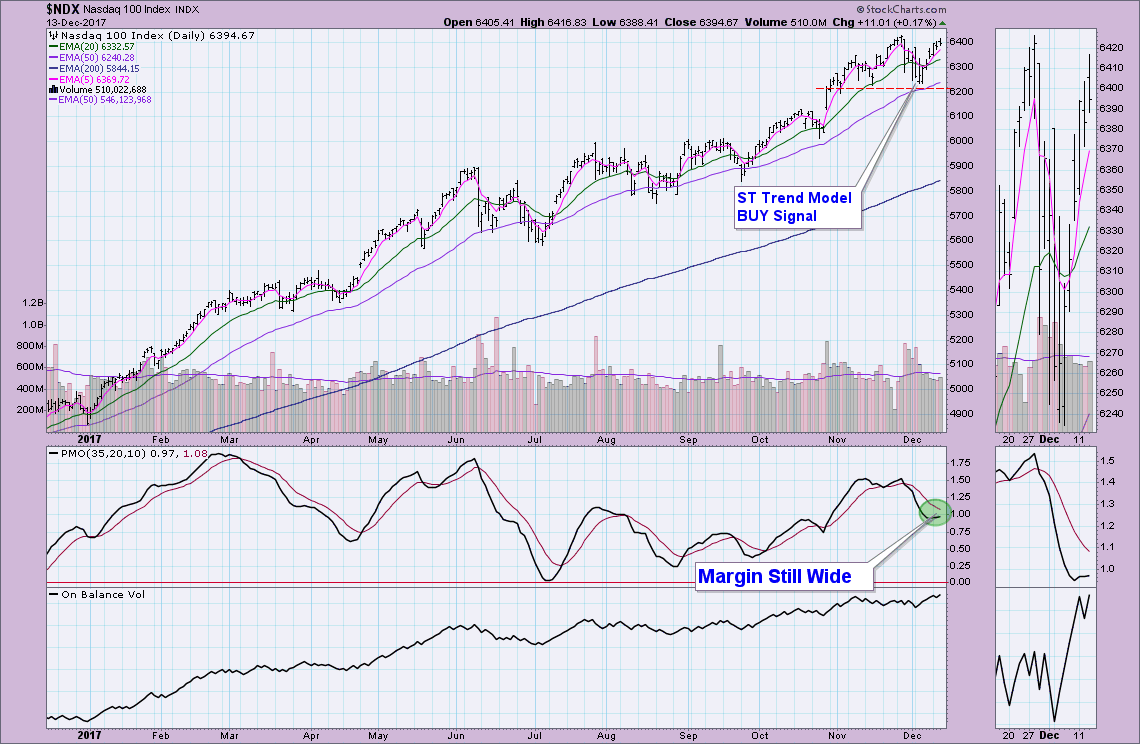

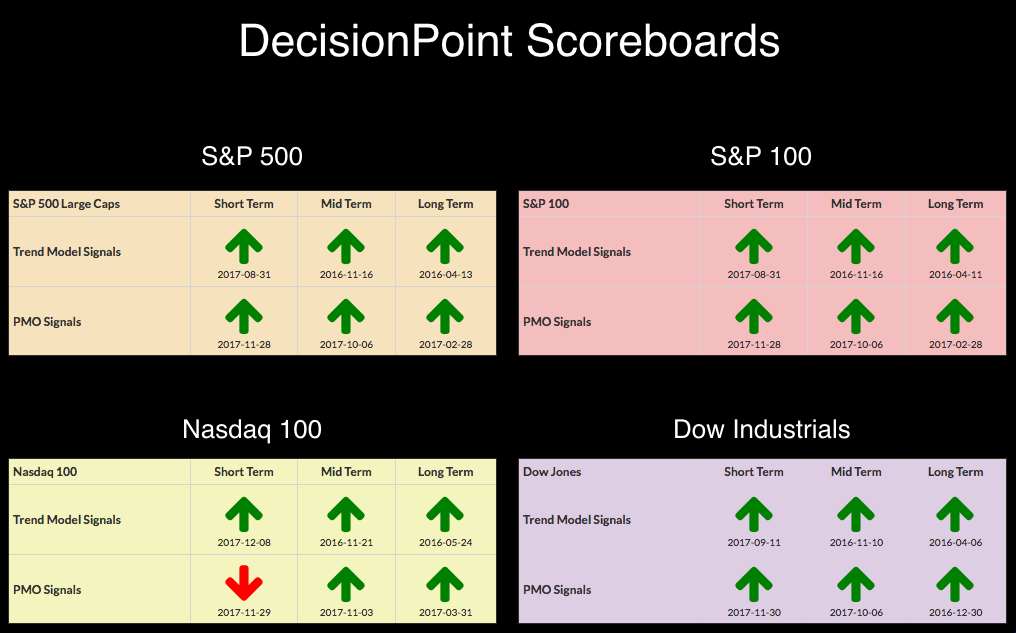
No new changes to the DecisionPoint Scoreboards. The NDX is holding onto its PMO SELL signal and it still has some margin to cover before the new PMO BUY signal can generate. Of particular interest today, and of course coming on the heels of a very bullish blog on the Dollar, today's drop could be starting the beginning of a right shoulder.
The purpose of the DecisionPoint Alert Daily Update is to quickly review the day's action, internal condition, and Trend Model status of the broad market (S&P 500), the nine SPDR Sectors, the U.S. Dollar, Gold, Crude Oil, and Bonds. To ensure that using this daily reference will be quick and painless, we are as brief as possible, and sometimes we let a chart speak for itself.
STOCKS
IT Trend Model: BUY as of 11/15/2016
LT Trend Model: BUY as of 4/1/2016
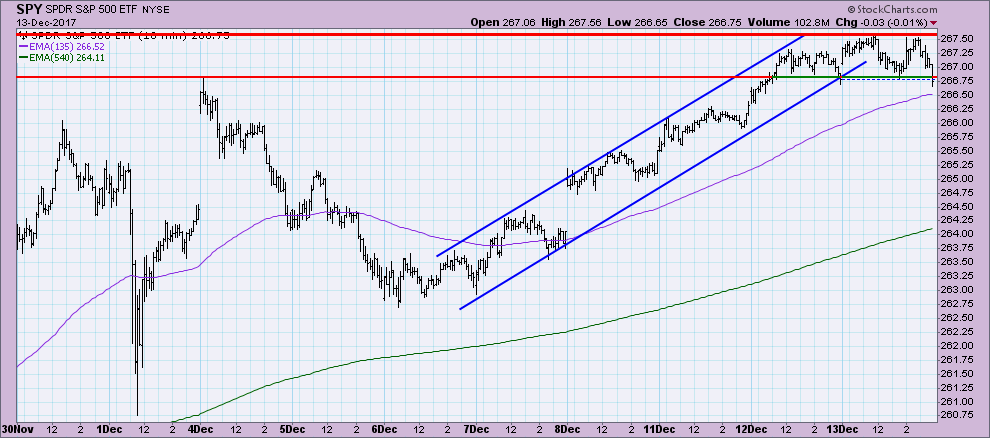
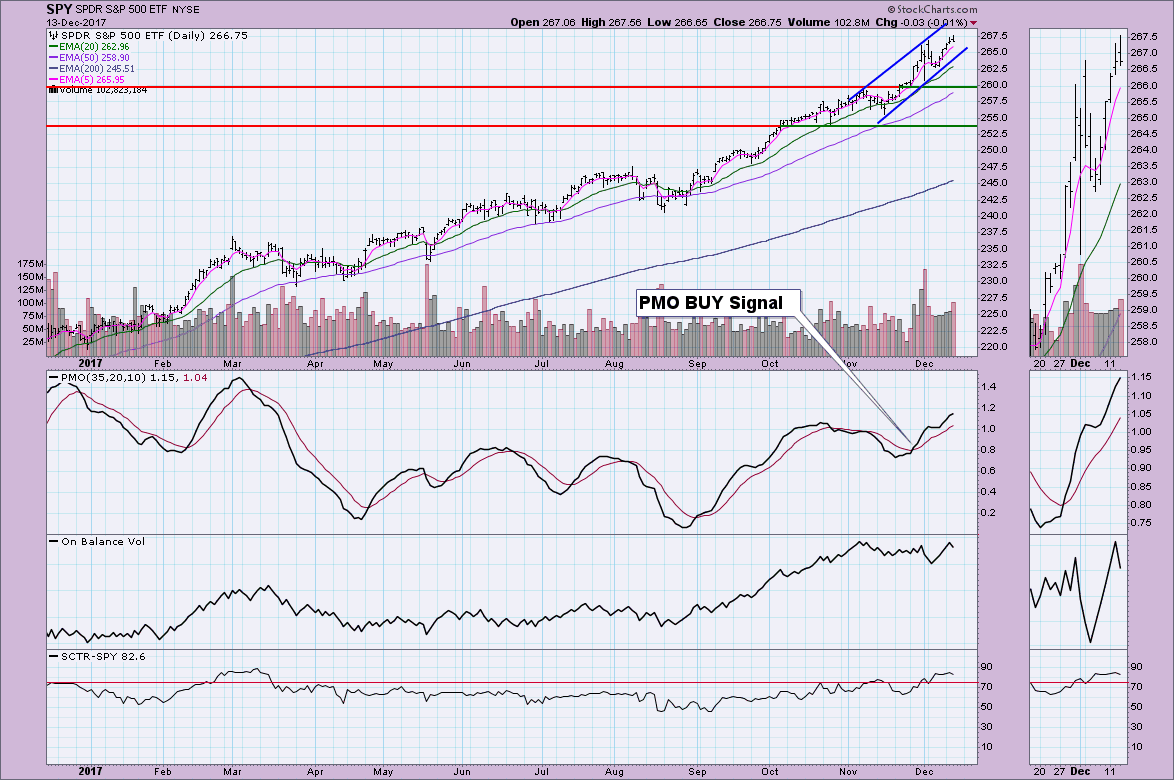
It appeared it was going to be a nice rally when I closed the MarketWatchers show today at 1:30p EST. However, it ultimately formed a bearish double-top and technically has penetrated the neckline today. A minimum downside target would be around $266 for the SPY. Nothing horrible, just more consolidation after reaching new all-time highs today.
It wouldn't surprise me at all to see the market pause for a moment after hitting all-time highs. We've seen it before. The rising trend channel is intact and this bull market is pushing price ever higher.
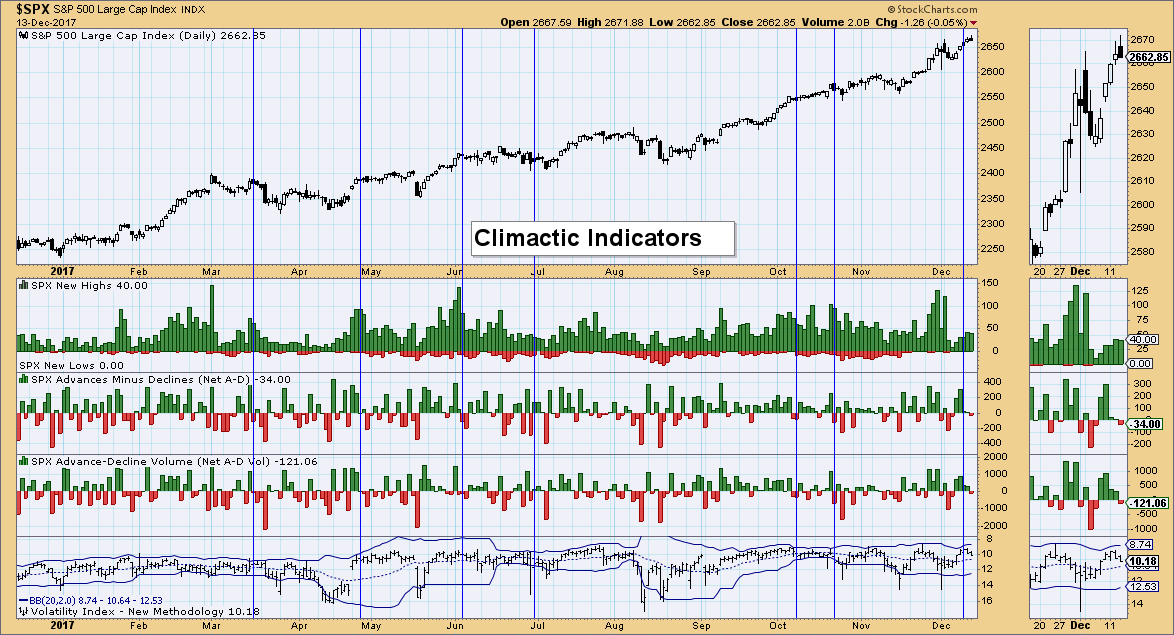
Climactic Indicators: Nothing of interest today. The VIX readings are moving lower on my inverted scale. Overbought conditions on the VIX didn't really amount to much a few days ago. I'll be watching to see if it begins to move below its average and toward the bottom Bollinger Band. If we get a pause or pullback, that could make people nervous.
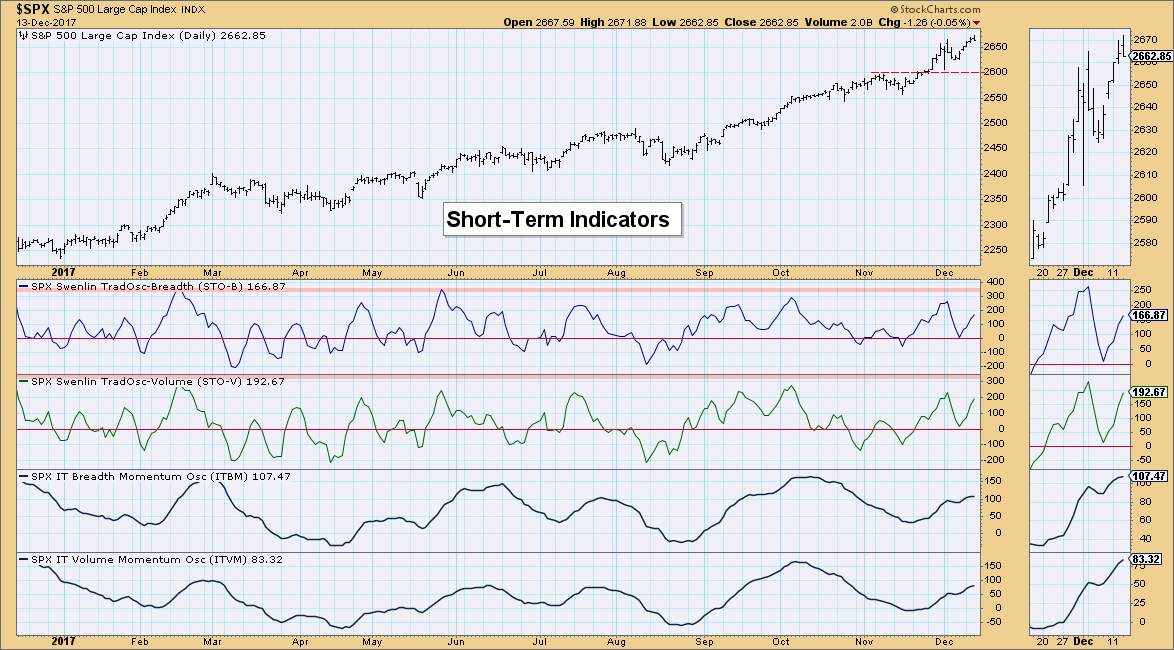
Short-Term Indicators: These still look great to me, the only issue is that they are getting overbought. If we see a market pause, I would expect them to turn down. We actually want them to at this point to set up an oversold bottom. For now, they are rising strongly and suggest higher prices in the near term.
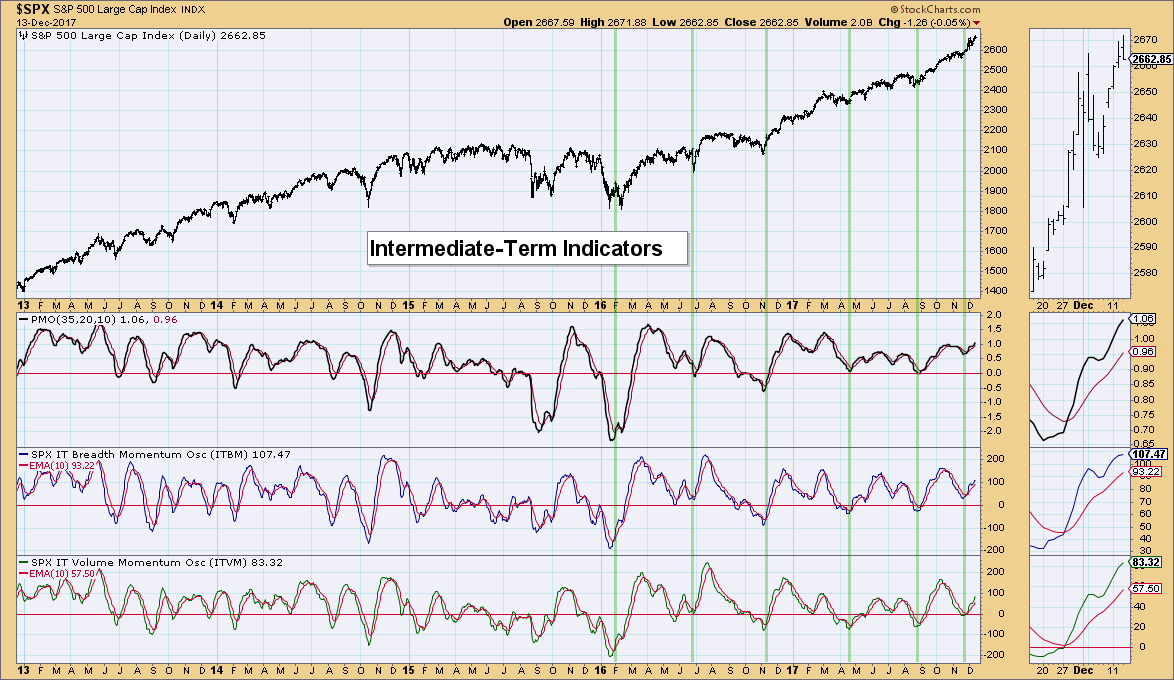
Intermediate-Term Indicators: While I'm seeing some deceleration on the ITBM, it is very small. I don't worry too much until I see a negative crossover. Notice the 'head fake' last week--a drop, but no negative crossover. These indicators are not yet overbought so higher prices are likely in the intermediate term.
Conclusion: Indicators still suggest higher prices, but I suspect we will see a bit of consolidation first. This would be good to unwind overbought conditions that are arising on the short-term indicator suite.
DOLLAR
IT Trend Model: BUY as of 12/12/2017
LT Trend Model: SELL as of 05/24/2017
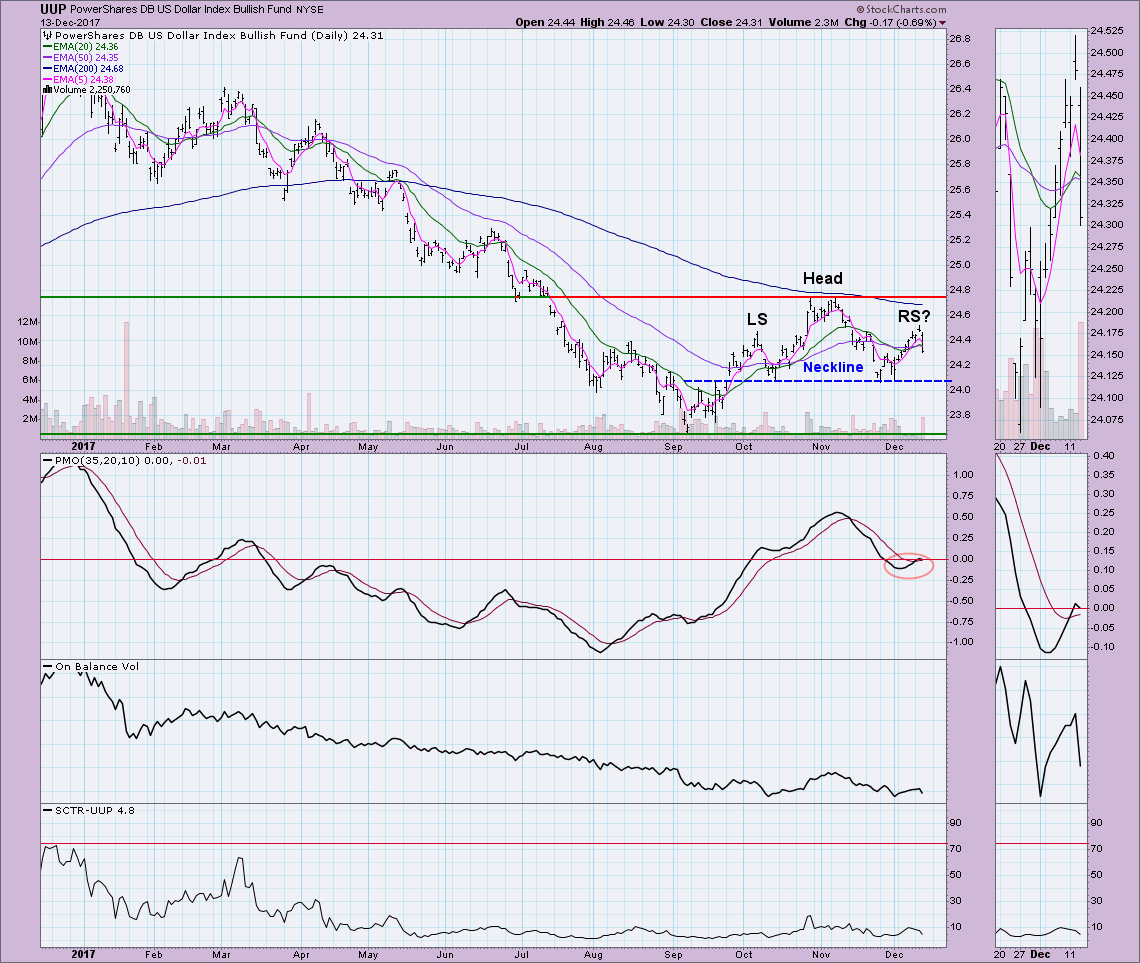
Given the recent PMO BUY signal coinciding with an ITTM BUY signal caused by the 20-EMA crossing above the 50-EMA, I suspected that we wouldn't get a head and shoulders pattern. Well, it appears it is forming. The IT Trend Model BUY signal is already in jeopardy and the PMO was yanked downward by today's large decline. UUP is in a bear market configuration (50-EMA < 200-EMA) so seeing this pattern continuing to form is a problem. This negative day could easily end up overridden by a snap back rally. However, there are concerns that need to be addressed and here you are.
GOLD
IT Trend Model: NEUTRAL as of 10/20/2017
LT Trend Model: BUY as of 4/12/2017
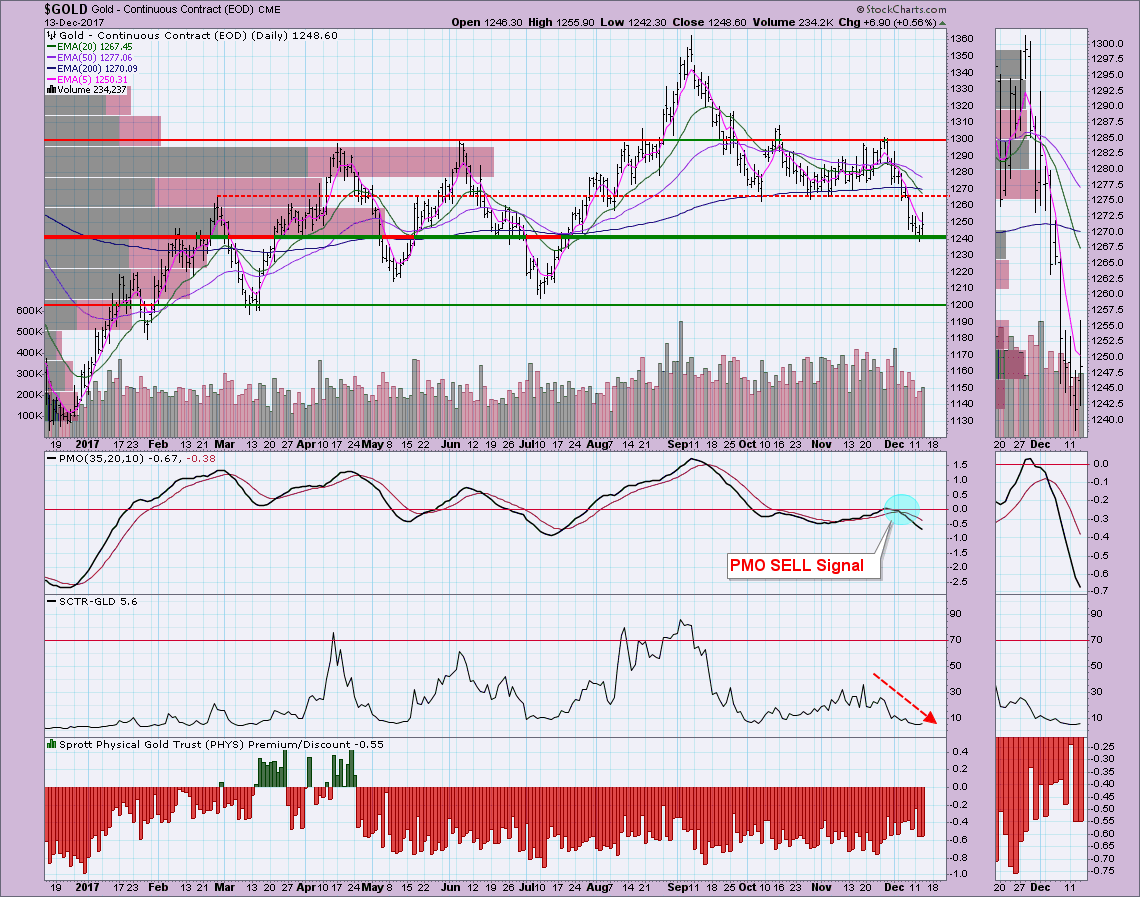
Interestingly, it appears Gold may have found support using the volume by price tool. The second highest amount of volume occurred just above the support level formed by yesterday's low. The PMO is going the wrong way and the SCTR is terrible. However, if the Dollar ends up executing that short-term head and shoulders, then expect Gold to hold this support. As for a big rally off this price bottom, I'm not so certain given the negative indicator set-up. The discount level is amping up, but it still isn't quite bearish enough to consider this decline over.
CRUDE OIL (USO)
IT Trend Model: BUY as of 11/2/2017
LT Trend Model: BUY as of 9/7/2017
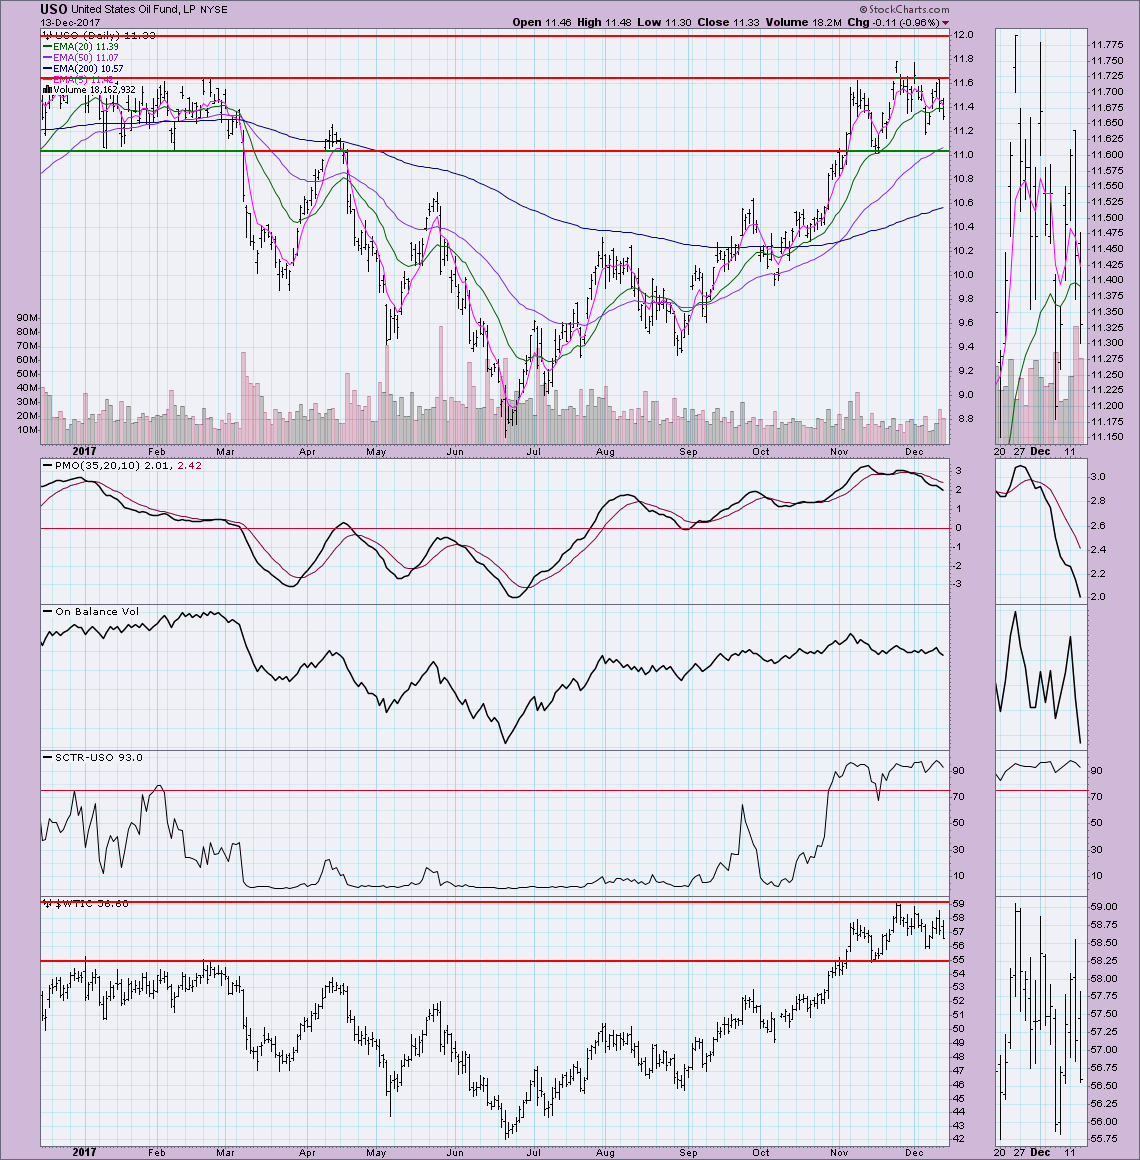
Looks like USO has formed a new trading channel along with $WTIC. The PMO looks very unhealthy, but the SCTR is hanging in there and the OBV is mostly neutral. At this point, I'd look for a trip to the bottom of this trading range. This will get the PMO out of overbought territory, setting up for a new rally.
BONDS (TLT)
IT Trend Model: BUY as of 11/8/2017
LT Trend Model: BUY as of 6/16/2017
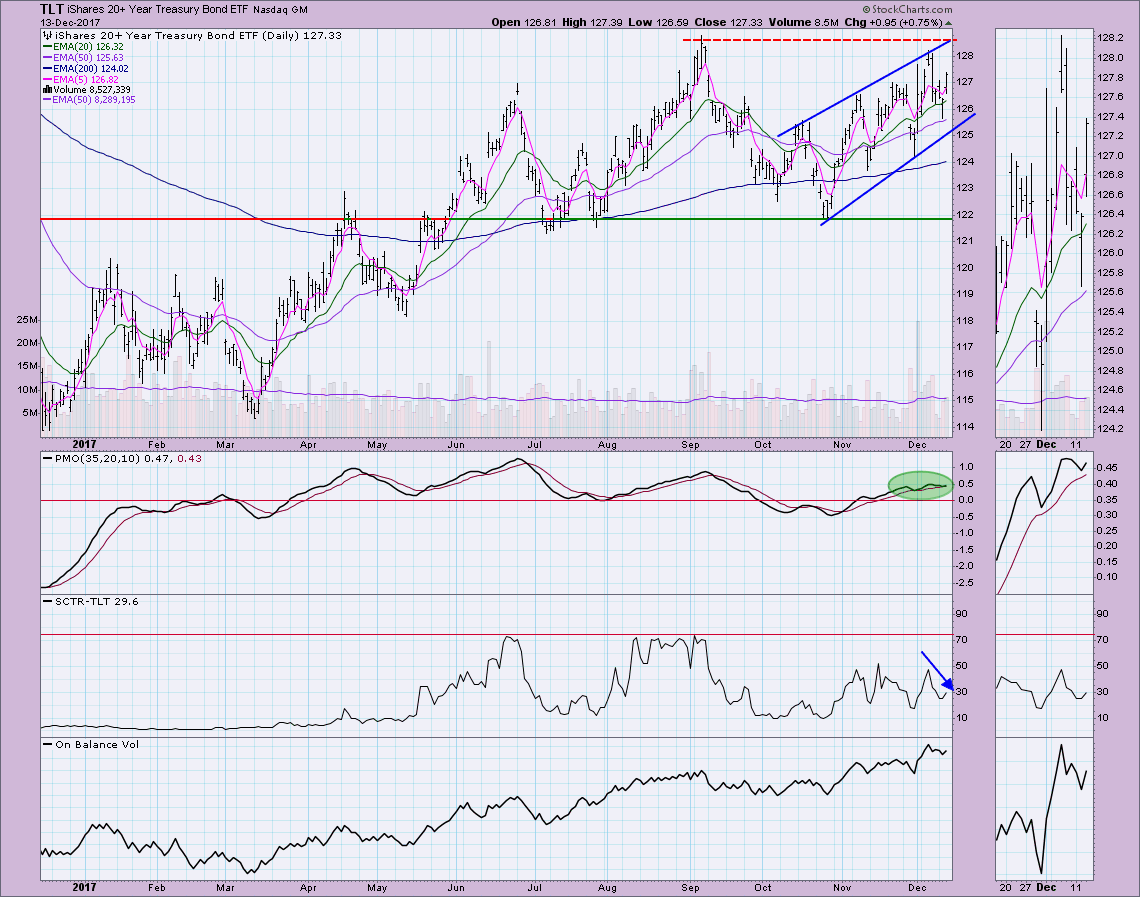
I see this chart and I see confusion. The PMO is hesitating all the way up and is not yet overbought. I like that it isn't overbought, but momentum doesn't seem to be able to get going. The SCTR and OBV don't look great. I see a rising wedge pattern which is bearish, but the EMAs are still configured bullishly. If I were to see the 5-EMA drop below the 20-EMA, that would likely be the bearish turning point.
Helpful DecisionPoint Links:
DecisionPoint Shared ChartList and DecisionPoint Chart Gallery
Price Momentum Oscillator (PMO)
Swenlin Trading Oscillators (STO-B and STO-V)
Technical Analysis is a windsock, not a crystal ball.
Happy Charting!
- Erin
**Don't miss DecisionPoint Commentary! Add your email below to be notified of new updates"**

