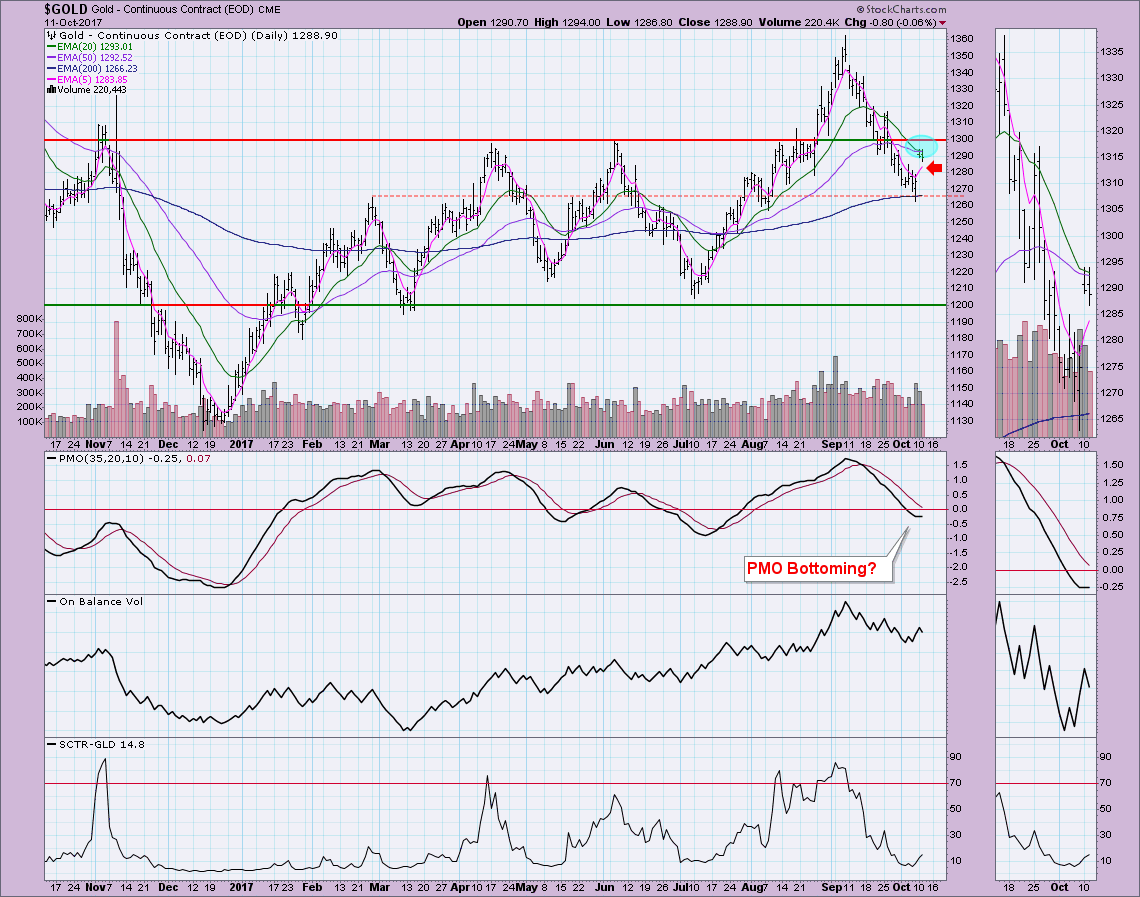
Carl and I have been watching the Gold chart carefully for a likely Intermediate-Term Trend Model (ITTM) Neutral Signal. However, with the rally of the last two days, both the 20-EMA and 50-EMA have slowed their descent. A negative 20/50-EMA crossover will trigger that ITTM Neutral signal. Why not a SELL signal? If the 50-EMA is still above the 200-EMA, we're looking at a LT bullish trend and we choose to move to a neutral signal (cash or fully hedged) rather than make a bearish short during a bullish LT trend.
We generally don't see many gaps on Gold, but yesterday we did. Price was lower on the day and it looks like we could be looking at a possible island which is a reversal pattern. The 1300 level has caused Gold some problems earlier in the year, but it isn't an impenetrable wall as the August breakout proved. A PMO bottom right here would certainly improve my outlook for Gold. The last two short-term bottoms on the OBV visible in the thumbnail were in a positive divergence with similar price bottoms; I see this breakout as confirmation of that positive divergence. The SCTR is starting to show some improvement and this gap up came after a test of the 200-EMA. I thought that we'd see a test much lower than that, but ultimately it wasn't necessary to clear overbought conditions for the PMO.
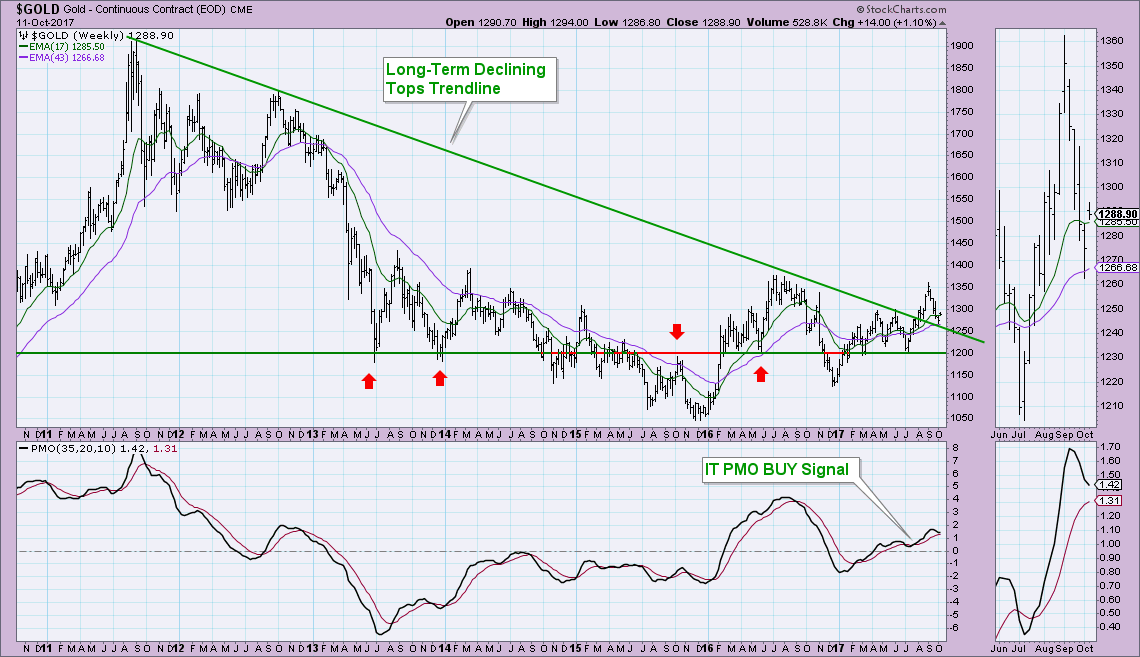
The longer-term picture is a bit blurry. As far as price action, the probable bounce off the declining tops trend line (the latest OHLC bar isn't final until Friday) looks good and supports a bullish conclusion. The PMO has topped and is declining, but it does look like it's decelerating.
Conclusion: The PMO is turning up on the daily chart right in near-term oversold territory just as price is bouncing off 200-EMA support. I've been bearish on Gold, but the picture is improving. Avoiding a negative 20/50-EMA crossover would be optimal to avoid a whipsaw ITTM Neutral signal. I would like to see the 1300 level recaptured. Until then, Gold isn't out of the woods.
Helpful DecisionPoint Links:
DecisionPoint Shared ChartList and DecisionPoint Chart Gallery
Price Momentum Oscillator (PMO)
Swenlin Trading Oscillators (STO-B and STO-V)
Technical Analysis is a windsock, not a crystal ball.
Happy Charting!
- Erin
**Don't miss DecisionPoint Commentary! Add your email below to be notified of new updates"**


