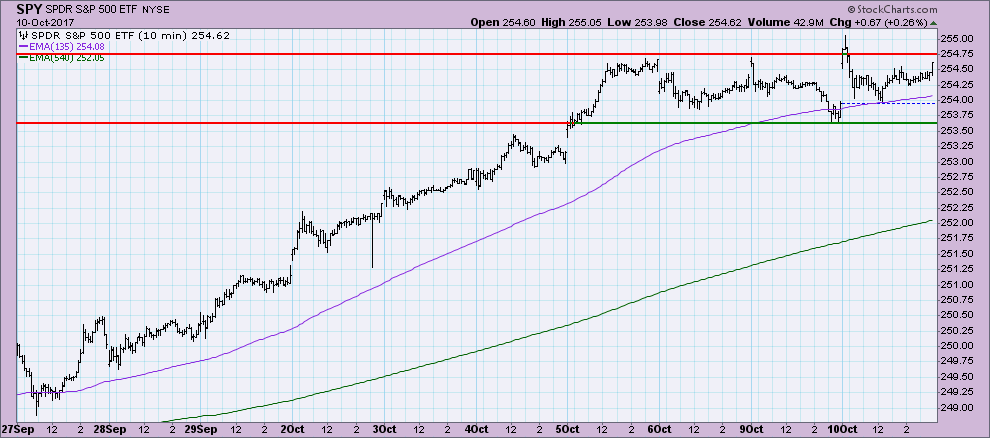
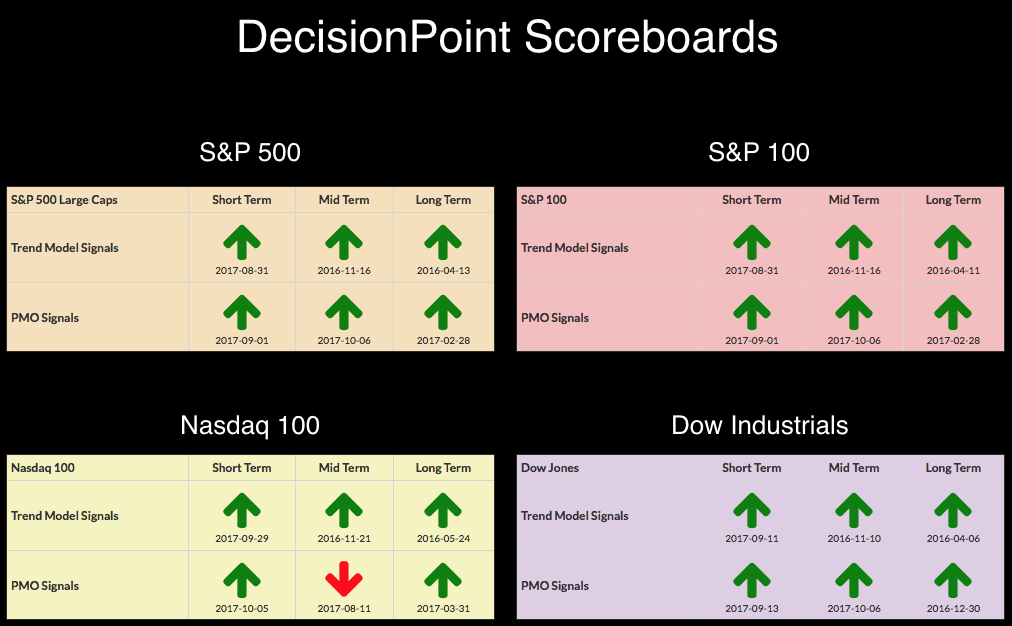
 No changes to the DP Scoreboards today, but you can see that every signal is a BUY signal except the IT PMO signal on the NDX. Check out my ChartWatchers article to learn more about why that is the case. Ultra-short-term indicators had pointed to a possible "rally pop" today, which we received on the open. However, there wasn't any follow-through.
The purpose of the DecisionPoint Alert Daily Update is to quickly review the day's action, internal condition, and Trend Model status of the broad market (S&P 500), the nine SPDR Sectors, the U.S. Dollar, Gold, Crude Oil, and Bonds. To ensure that using this daily reference will be quick and painless, we are as brief as possible, and sometimes we let a chart speak for itself.
SIGNALS: Here we include charts of any important signal changes triggered today by our Intermediate-Term Trend Model.
NO NEW SIGNALS TO REPORT.
NOTE: Mechanical trading model signals define the implied bias of the price index based upon moving average relationships, but they do not necessarily call for a specific action. They are information flags that should prompt chart review. Further, they do not call for continuous buying or selling during the life of the signal. For example, a BUY signal will probably return the best results if action is taken soon after the signal is generated. Additional opportunities for buying may be found as price zigzags higher, but the trader must look for optimum entry points. Conversely, exit points to preserve gains (or minimize losses) may be evident before the model mechanically closes the signal.
STOCKS
IT Trend Model: BUY as of 11/15/2016
LT Trend Model: BUY as of 4/1/2016
This morning's rally pop put prices at all-time highs. It was very short-lived as the market retreated and then moved mostly sideways the remainder of the day, not quite able to return to all-time highs to finish the day.
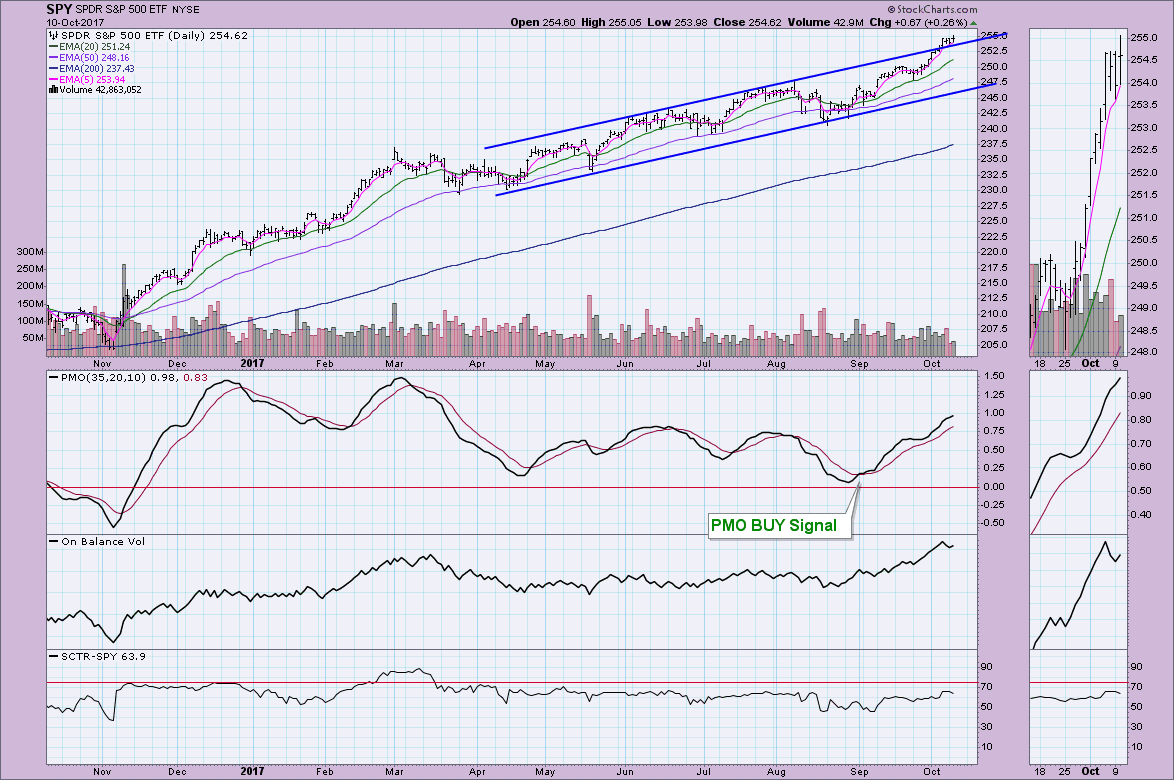
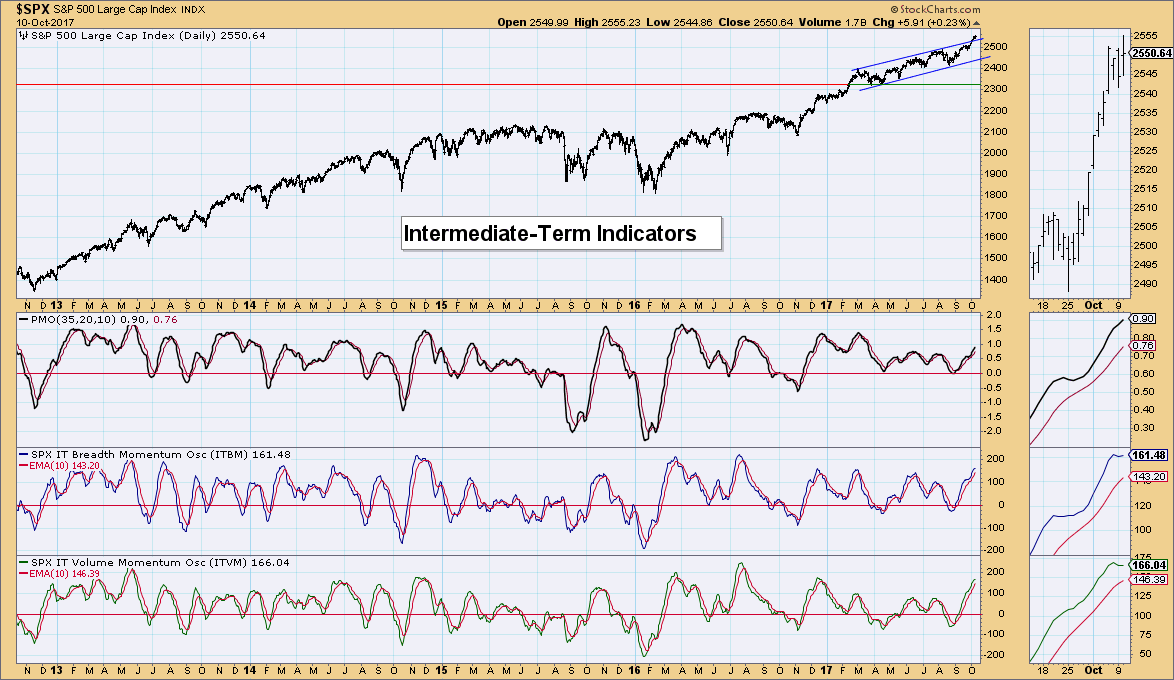
Interestingly, we can see the that last four days of consolidation have kept price perched on top of the rising trend channel. Indicators are very healthy with only a slight deceleration of the PMO's rise. I don't see anything here that would indicate a market correction or even a pullback. In typical fashion for this bull market, it has a paused rather than correct or even pullback.
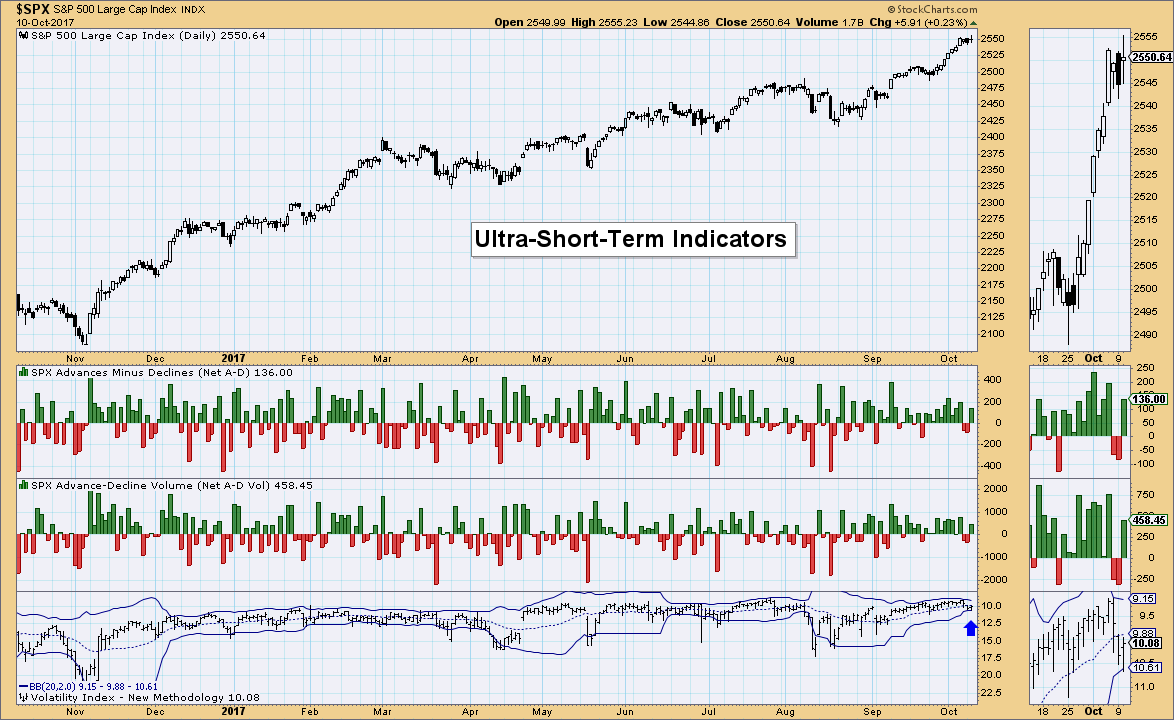
Ultra-Short-Term Indicators: Yesterday, I commented in the MarketWatchers LIVE show that we were finally seeing VIX readings below its average (inverse scale). Penetrations of the Bollinger Bands are highly likely with even the slightest move given the margin has shrunk to its smallest since this summer. Today we see that the VIX has actually dropped below the BB. Given this, in combination with above average readings in breadth, I would expect another rally pop tomorrow. There is a chance this is an exhaustion, but it seems more likely a possible very very short-term buying initiation.
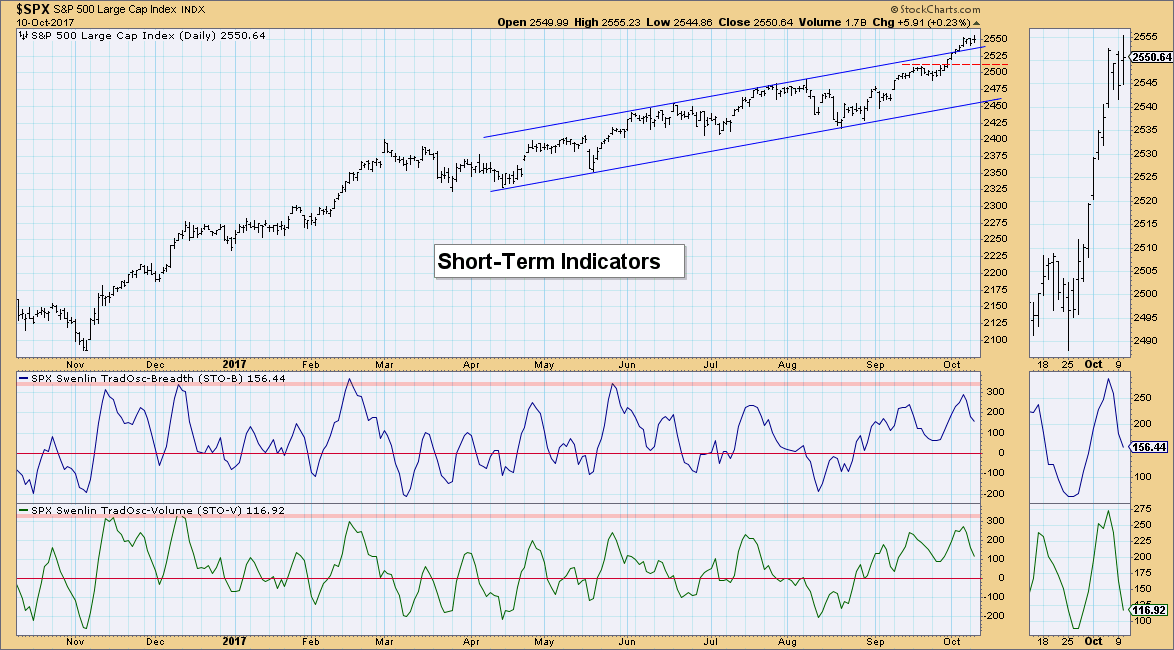
Short-Term Indicators: Only a few days of price consolidation and the short-term indicators have managed to unwind nearly back to the zero line. I'm looking for these indicators to bounce above the zero line to show internal strength in this bull market. If it drops below, that doesn't mean the bull market is over, it just tells us there could be a pullback or more weak price action.
Intermediate-Term Indicators: These indicators had topped, but are now turning back up. We will want to keep a close eye on this chart. Typically negative crossover tops precede pullbacks or corrections.
Conclusion: It only took a few days of consolidation for our short-term indicators to clear overbought conditions. I'd like to see them turn up above the zero line to confirm internal strength, but IT indicators are still bullish enough that I'm not looking for a big pullback or correction just yet. Consolidation seems to be providing the relief needed to our short-term indicators which does speak to the strength of the rally. The indicators are taking any opportunity to drop back out of overbought territory, including consolidation. The most important indicators right now are the ITBM and ITVM, they need to continue higher and avoid a negative crossover. If they do top, a caution flag is waving.
DOLLAR
IT Trend Model: NEUTRAL as of 3/21/2016
LT Trend Model: SELL as of 05/24/2017
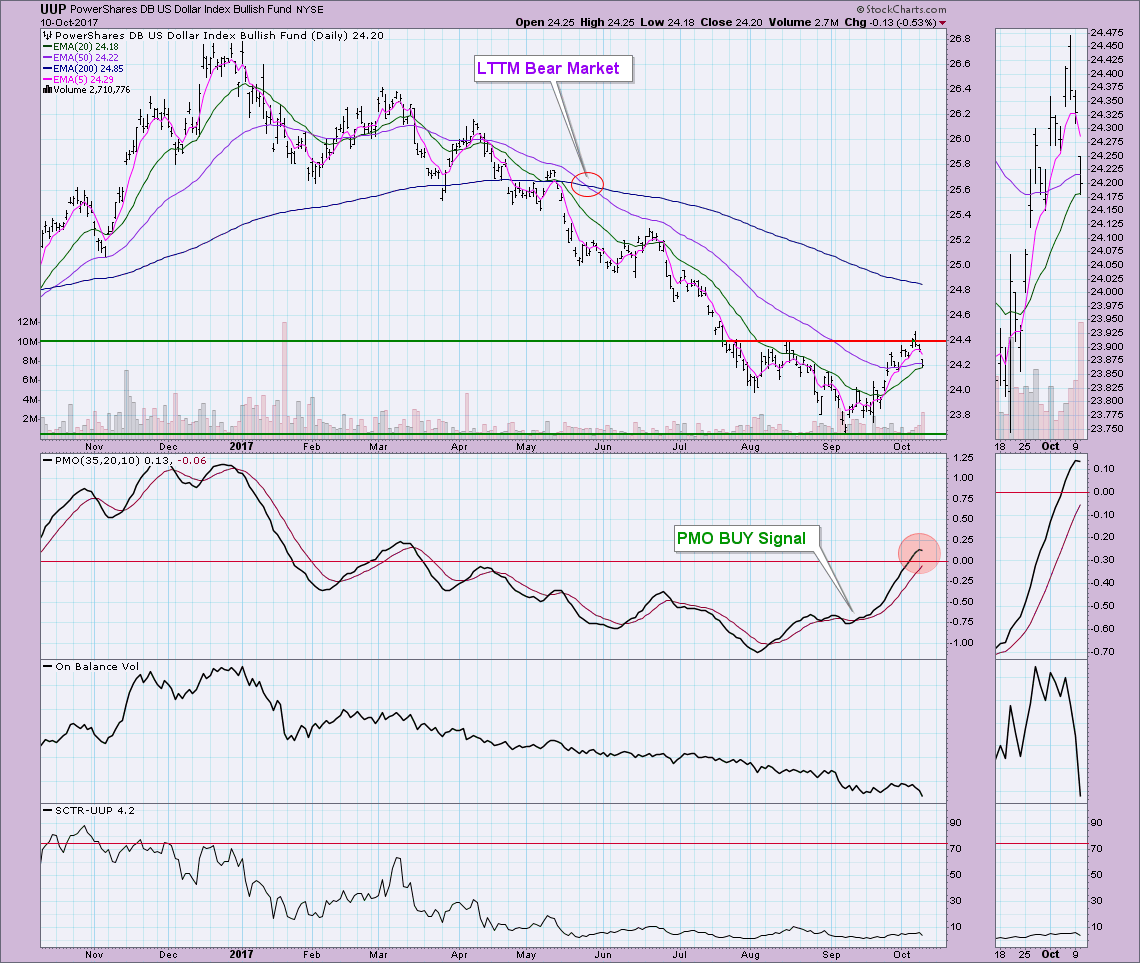
The Dollar turned back down at overhead resistance, gapping down to the 20-EMA. The PMO has now topped. What looked like a very promising rally in the Dollar was stalled. The 20/50-EMAs were poised for a positive crossover which would have initiated an IT Trend Model BUY signal. This is likely a natural pullback at resistance. I suspect we will see a resumption of the rally soon. Support at the September highs around $24 should hold, but the increasing negative volume is concerning.
GOLD
IT Trend Model: BUY as of 7/31/2017
LT Trend Model: BUY as of 4/12/2017
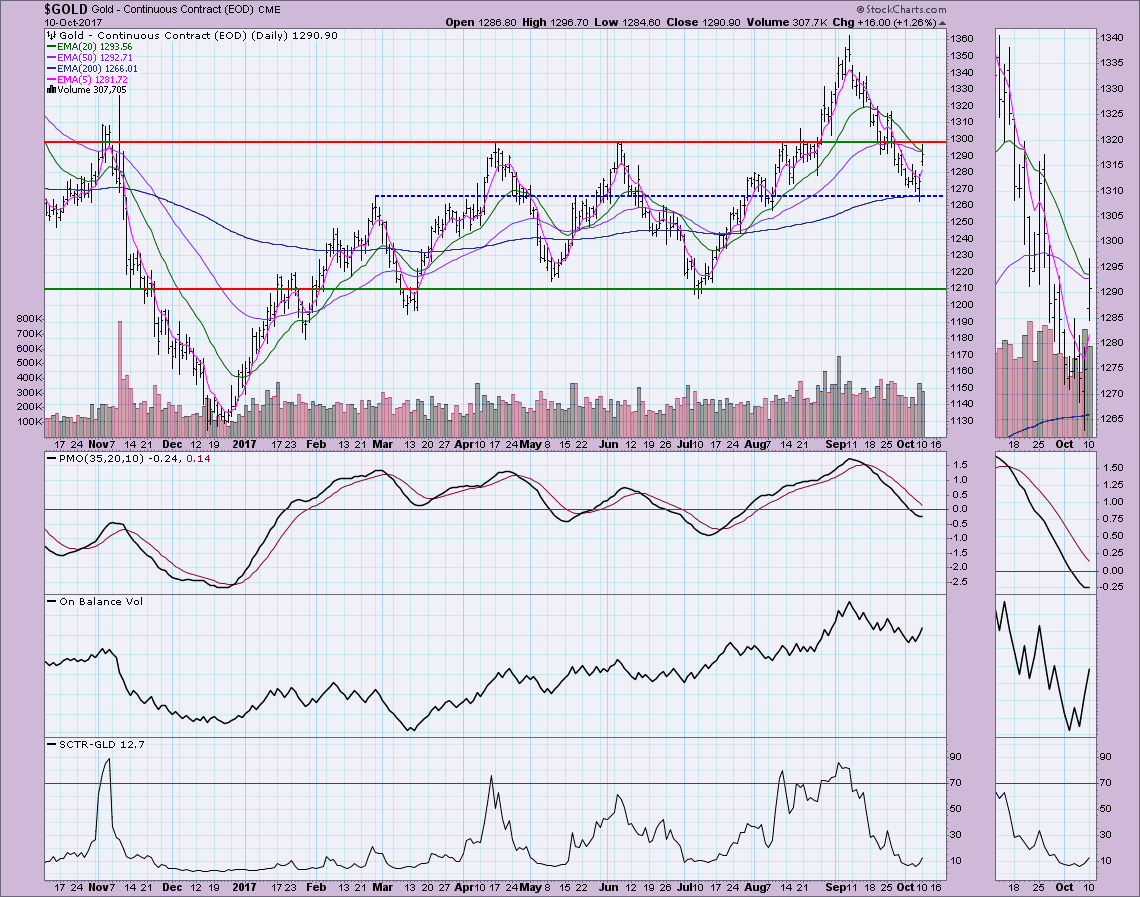
Gold narrowly avoided an IT Trend Model Neutral signal as the 20-EMA turned up with price above the 50-EMA. I don't think Gold is out of the woods yet. 1300 has posed strong resistance and I would expect to see it hold. The PMO is turning up and the Dollar is not looking too good, but I do believe we will see the correction continue, especially if the 1300 level cannot be broken. If price breaks out above 1300, then I'd look for a continued rally for Gold.
CRUDE OIL (USO)
IT Trend Model: SELL as of 8/29/2017
LT Trend Model: SELL as of 3/9/2017
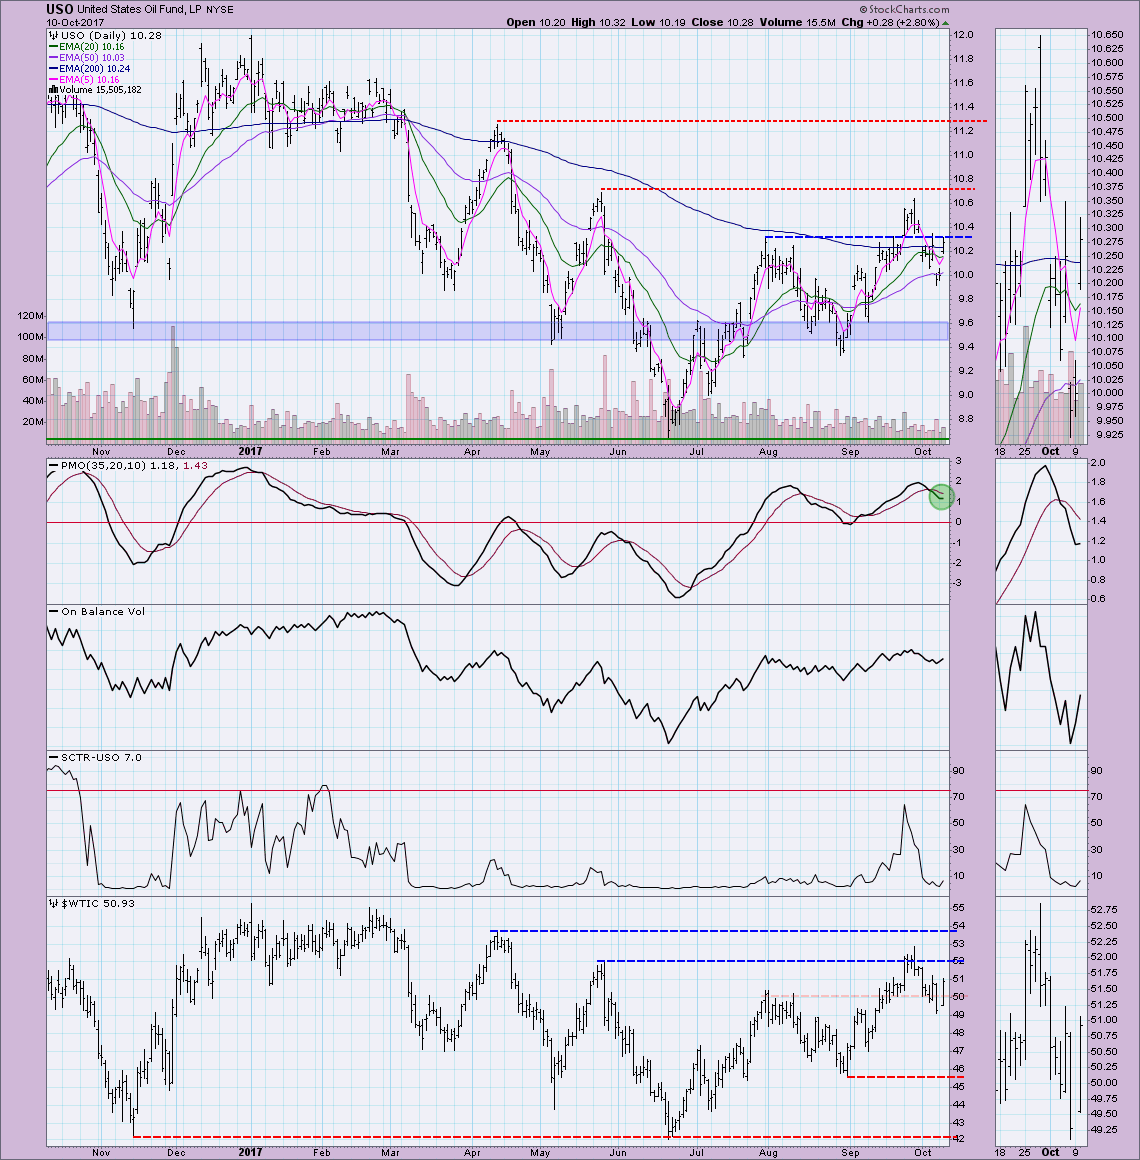
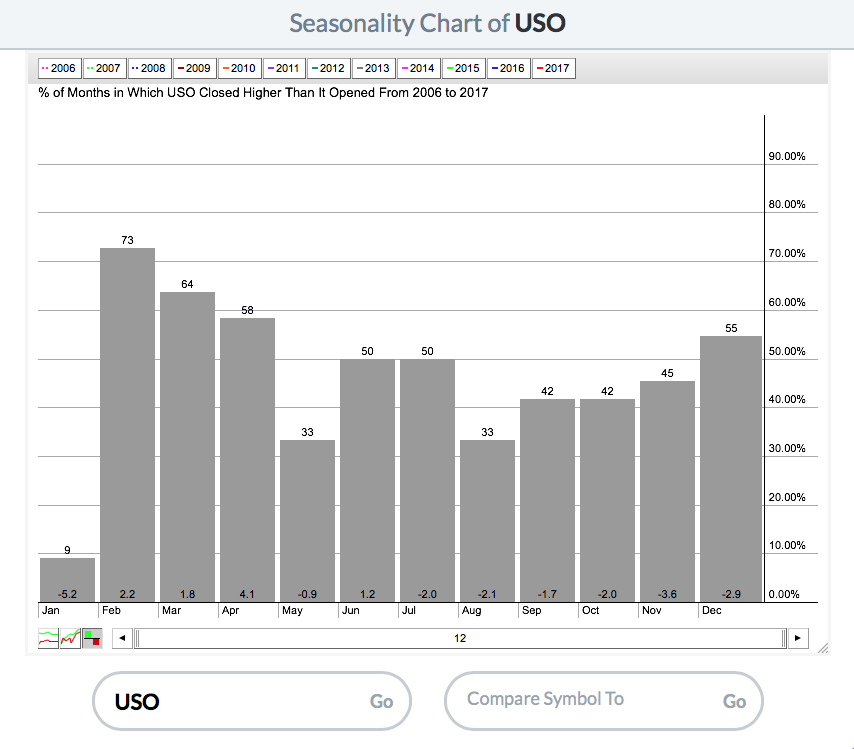
Oil and USO have been very volatile. Today's rally on the gap was impressive. The rally pulled the PMO out of its decline. I remain bearish on Oil. Although Oil broke above $50/barrel, $52 has held strongly. That corresponds with the $10.60 level for UUP. The PMO is overbought and I suspect this will be a fake out move. If you look at the seasonality graphic beneath the chart, you'll see that we are entering a typically poor performance quarter for Oil/USO. If we do get a rally above $10.35, I wouldn't look for it to move much higher than $10.60.
BONDS (TLT)
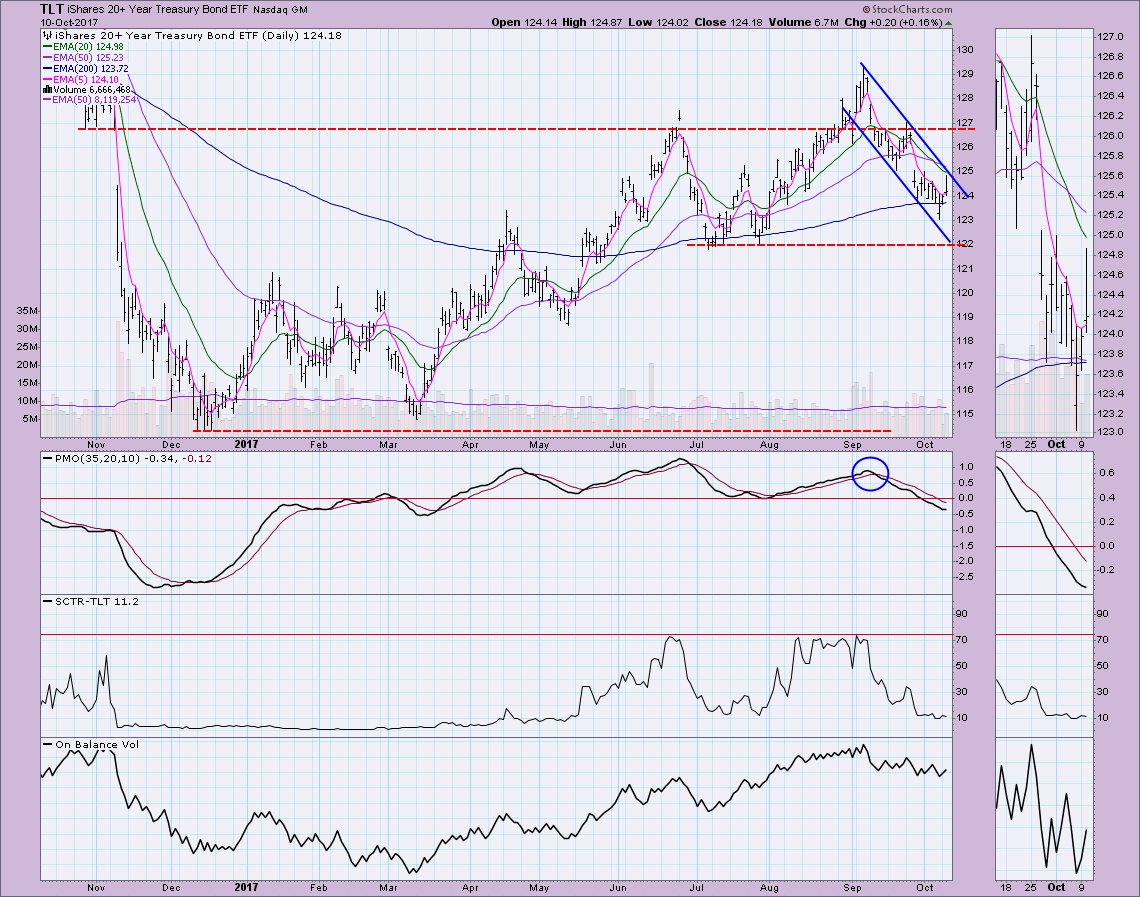
IT Trend Model: Neutral as of 10/5/2017
LT Trend Model: BUY as of 6/16/2017
Bonds saw a rally today, but price retreated back to the open after tapping on the top of the declining trend channel. I continue to look for TLT to test $122.
Helpful DecisionPoint Links:
DecisionPoint Shared ChartList and DecisionPoint Chart Gallery
Price Momentum Oscillator (PMO)
Swenlin Trading Oscillators (STO-B and STO-V)
Technical Analysis is a windsock, not a crystal ball.
Happy Charting!
- Erin
**Don't miss DecisionPoint Commentary! Add your email below to be notified of new updates"**

