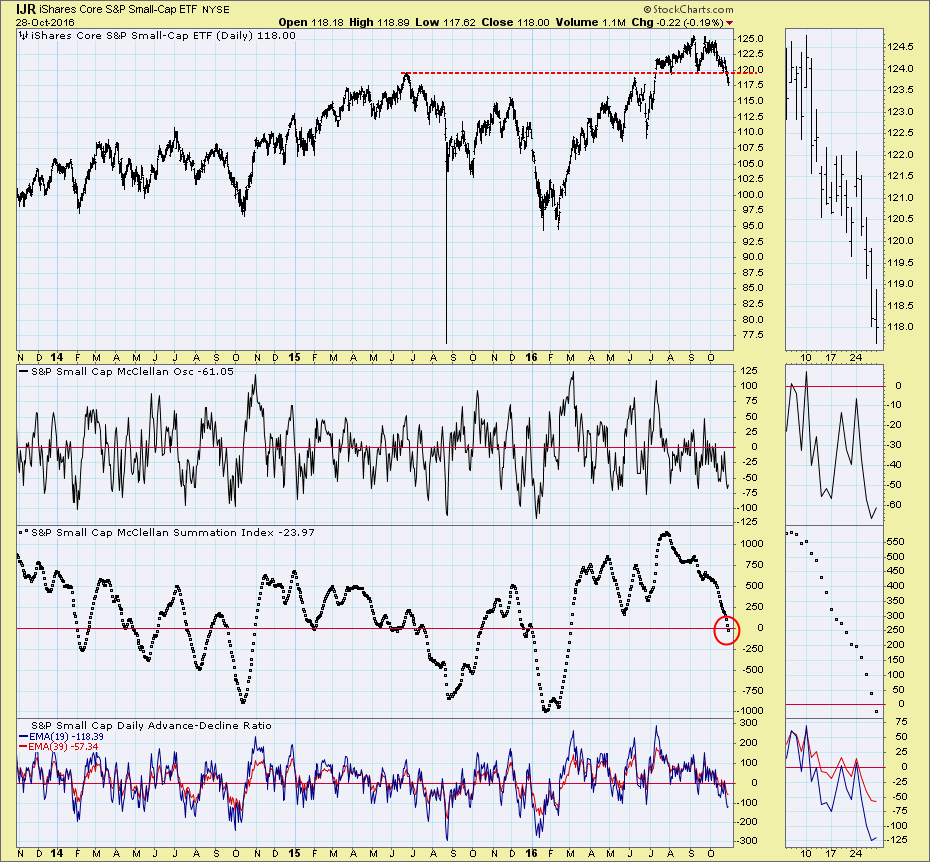
Last week Erin's article on the Russell 2000 gave me reason to browse the Straight Shots collection of indicator charts for the S&P 600 Small-Cap Index. Straight Shots allow us to shoot straight through a collection of indicator charts that are derived from the component stocks in the selected index. My intent was to write an article highlighting that particular group of small-cap indicators; however, I got sidetracked when I saw the McClellan Summation Index chart.
To quickly review, the McClellan Oscillator and Summation Index (SI) were developed by Sherman and Marian McClellan back in the 1960s. You begin by calculating a 19EMA and 39EMA of the daily advances minus declines (bottom panel). The Oscillator is result of subtracting the 39EMA from the 19EMA, and the SI (middle indicator panel) is the cumulative total of the daily Oscillator reading. The Oscillator (the top indicator panel) tends to be quite active, but the SI presents a more readable summary of the shifting tides of market liquidity.
What caught my attention was that (1) the S&P 600 ETF (IJR) price has broken down through an important support line, and (2) the SI has dropped below the zero line. A general rule is that market tops begin with money shifting out of small-cap stocks and into the more sturdy larger-cap stocks. Clearly the shift away from small-cap stocks is in progress, but the Summation Index weakness is especially worrisome. When the SI drops below the zero line, be prepared for accelerated selling. Obviously, disaster doesn't occur every time the SI goes negative, but also obvious is that a negative SI should always command our attention.
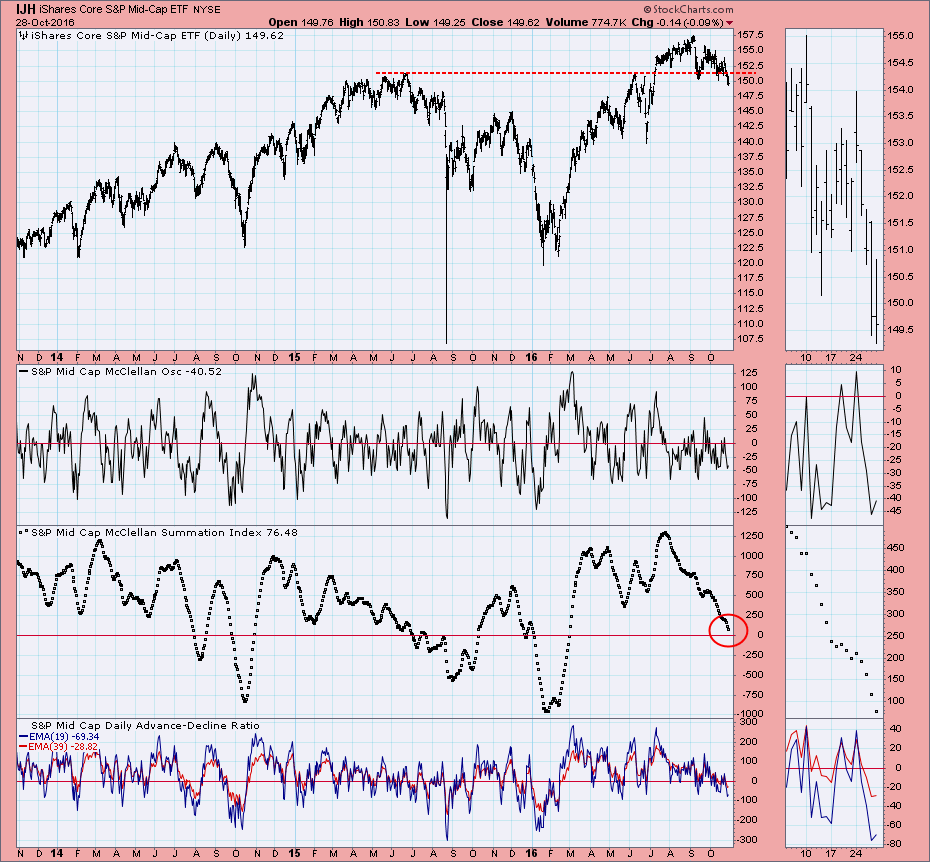
Looking up the food chain to mid-cap stocks, we can see that there is similar weakness here. The SI is still above the zero line, but absent a surge of market strength, the SI will probably go negative within a week.
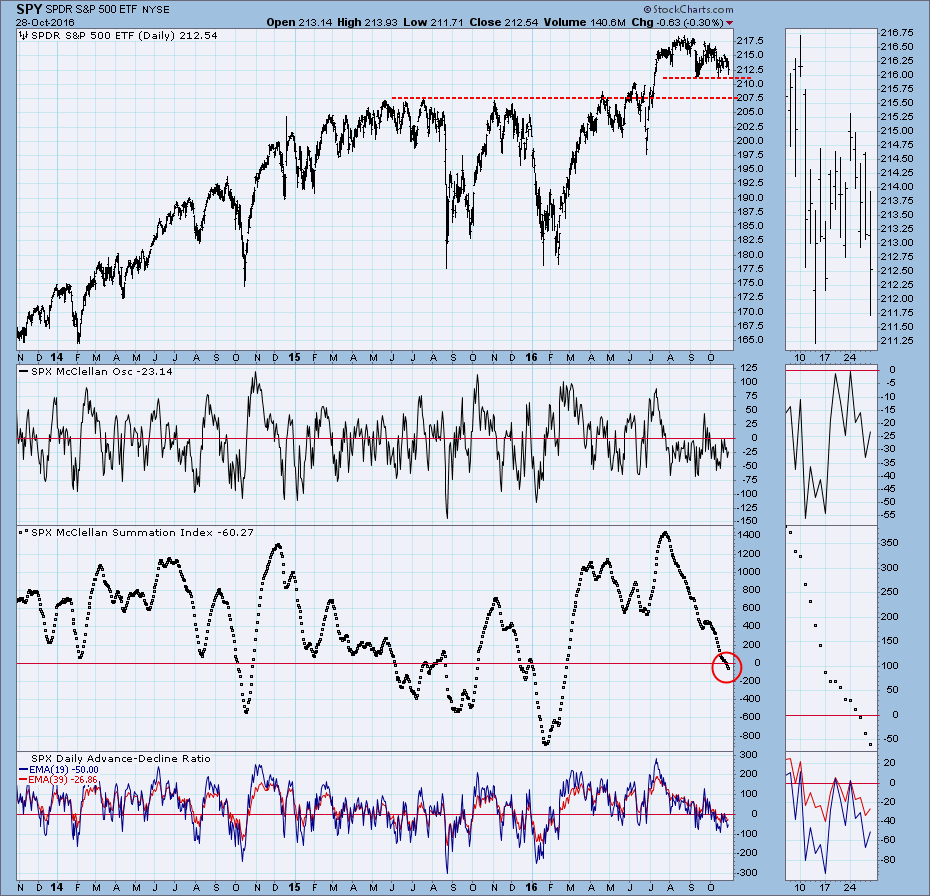
I expected to see more strength in large-cap stocks, but I was surprised to see that the S&P 500 SI dropped below the zero line two days ahead of the S&P 600 SI. On the positive side, price is still above significant support levels. This shows that, while there have been more declines than advances, the individual declines have been relatively small. This is possibly due to money flow from smaller-cap stocks keeping larger-cap stock prices a bit firmer.
CONCLUSION: When the Summation Index falls below the zero line, there is a strong possibility that serious price deterioration lies just ahead. The current condition of the SI for small-, mid-, and large-cap stocks is spreading that warning across the broad market, and both small- and mid-cap index prices have already broken support. Caution is advised!
PERSONAL NOTE: Back in the 1990s it occurred to me that maybe a good indicator could be developed by tracking the relationship of a fast and slow EMA of breadth. Fortunately, I didn't put too much work into this brilliant idea before I realized that the McClellans had beaten me to it by about 30 years. This realization also helped me see the beauty and simplicity of the McClellan Oscillator and Summation Index. While the charts above may seem confusing or complicated, they are simply based upon the changing relationship of a fast and slow moving average of breadth. Let the fact sink in, and it may help you understand how useful these indicators are.
The NEW DecisionPoint LIVE public ChartList has launched! Click on the link and you'll find webinar charts annotated just before the program. Additional "chart spotlights" will be included at the top of the list. Be sure and bookmark it!
Come check out the DecisionPoint Report with Erin Heim on Wednesdays and Fridays at 7:00p EST, a fast-paced 30-minute review of the current markets mid-week and week-end. The archives and registration links are on the Homepage under “Webinars”.
Technical Analysis is a windsock, not a crystal ball.
Happy Charting!
- Carl


