 Interestingly, Gold has put in a short-term bottom and has held onto it even through the Dollar's magnificent rally. This shows there is likely short-term internal strength and this current support could hold. There are still plenty of obstacles for Gold in the longer term as you'll see, but the new Price Momentum Oscillator (PMO) BUY signal is encouraging for the shorter term.
The longer term affects the intermediate term which in turn affects the short term so I'm going to start with the longer-term picture (monthly), followed by the intermediate-term picture (weekly) and the shorter-term daily chart.
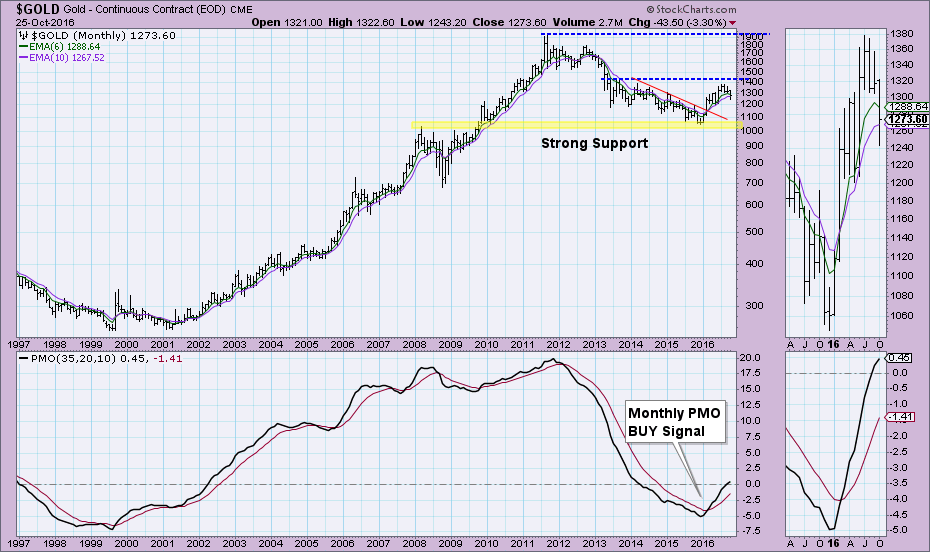
There are two positive attributes to the monthly chart worth noting. First and foremost is the monthly PMO BUY signal and continued positive momentum. Price broke out from a declining tops trendline (red) after testing strong support near the 1000 level. Unfortunately, the decline after failing to break above resistance is bearish. That breakdown hasn't posed a problem to the monthly PMO which is in positive territory, and price closed above the 10-month EMA.
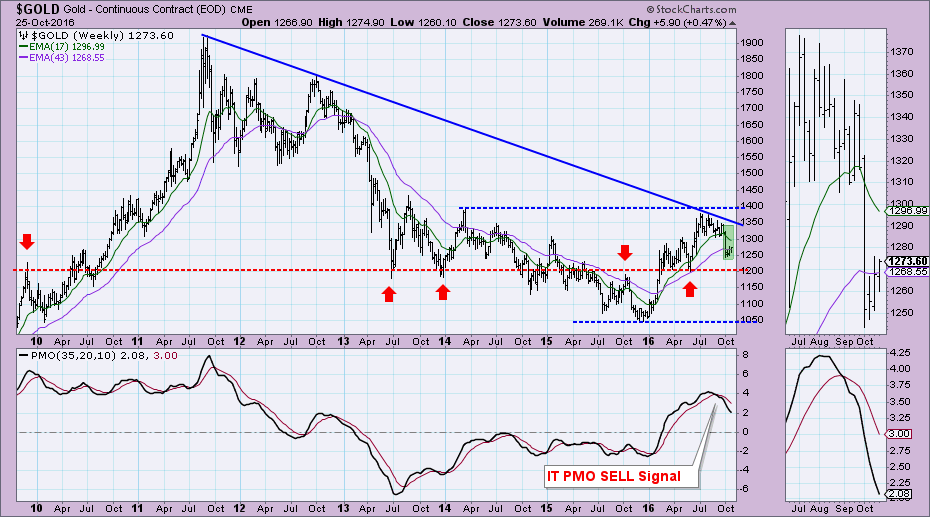
 The weekly chart has the most problems. Where do I start? The weekly PMO is on a SELL signal and accelerating lower. Two areas of overhead resistance held, the declining tops trendline and horizontal resistance at around 2014 high. Support is strong at the 1200 level given the horizontal has been tapped a few times...the more 'touches' the stronger the trendline or support line. Next problem is the possible reverse flag formation I've highlighted in green.
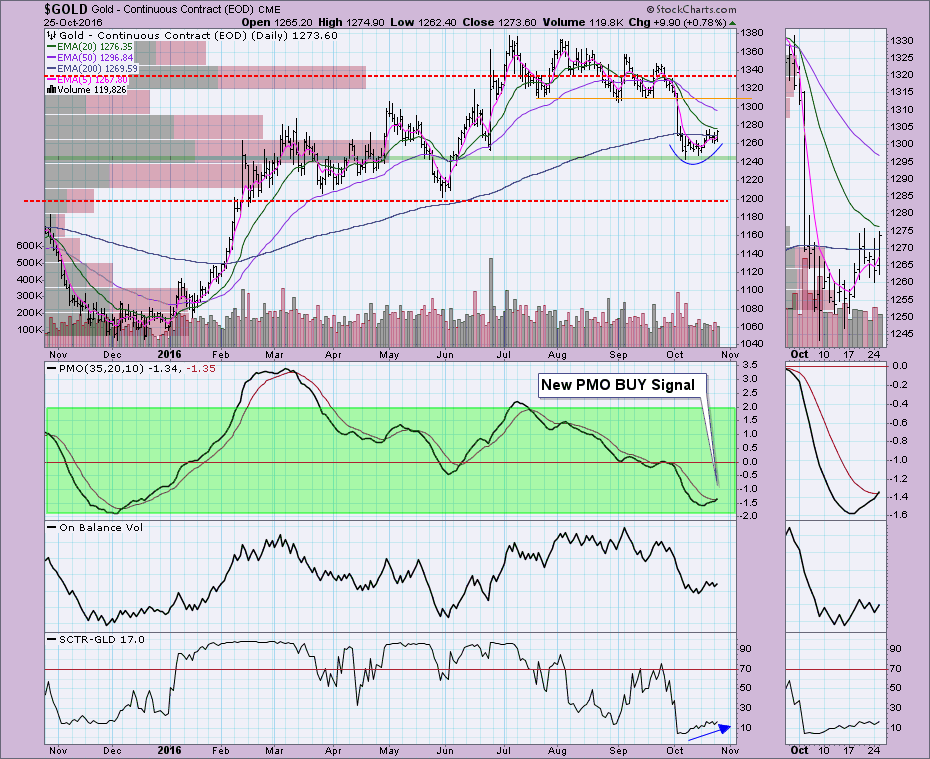
You might ask, "If the picture is so bleak, why did you title your article with a bullish headline?". The daily chart is the reason. I love seeing PMO crossover BUY signals at the bottom of the PMO range. Notice what happened after the one in late 2015 (although "past performance is no guarantee of future results" these signals are generally followed by a rally). The reverse flag noted on the weekly chart isn't as viable on the daily chart because of the rounded shape and noticeable rally off the lows. While this bottom doesn't line up with typical horizontal support, based on the volume by price bars, it is an area of price congestion that can certainly hold as support.

Conclusion: The short-term picture for Gold is bullish and suggests we will see a rally to return price back above 1300. The long-term monthly PMO and the short-term daily PMO are both on BUY signals and rising. The intermediate-term weekly PMO is dropping on a SELL signal. I suspect there will be continuation on this rally, but with the intermediate-term weekly chart looking negative, it won't likely pass overhead resistance at the 1380 level.
The NEW DecisionPoint LIVE public ChartList has launched! Click on the link and you'll find webinar charts annotated just before the program. Additional "chart spotlights" will be included at the top of the list. Be sure and bookmark it!
Come check out the DecisionPoint Report with Erin Heim on Wednesdays and Fridays at 7:00p EST, a fast-paced 30-minute review of the current markets mid-week and week-end. The archives and registration links are on the Homepage under “Webinars”.
Technical Analysis is a windsock, not a crystal ball.
Happy Charting!
- Erin

