
Many of you (like me) have your favorite or most important charts that you use consistently in your daily workflow. Rather than hunt for each of those charts within the DP ChartLists, why not find the ones you use regularly and create your own daily analysis ChartList. This will allow you to open up that ChartList and "click through" the charts you use one by one. Although this can take some effort to set up, the time you save will more than make up for the time used to set it up.
How do you start? First and foremost you need to quantify your daily routine. What do you look at first? Do you concentrate on one index or several? Do you go in-depth on one and then quickly review the high level charts on others? Here is a sample workflow that we will use to create a daily review ChartList. This workflow is the basis for the DecisionPoint Daily Blog (which will soon be coming to Stockcharts!).
Concentration/Review Order: SPX, Gold, Dollar (UUP), Oil (USO) and Bonds (TLT).
Analysis Breakdown: SPX - 10 min bar, daily bar, weekly bar, monthly bar; Gold - daily bar, weekly bar, monthly bar; Dollar (UUP) - daily bar, weekly bar; Oil (USO) - daily bar, weekly bar, monthly bar; and Bonds (TLT) - daily bar, weekly bar, monthly bar.
Indicators on charts: EMAs (as appropriate to timeframe), Volume (as applicable) and PMO
Indicator Charts: Volatile Short-term (CVI, Participation Index, Net Breadth/Volume); Short-term (STVO, STO-B, STO-V); and Intermediate-term (VTO, ITBM, ITVM)
First, I need to create and name my new ChartList. You'll find the "Create a New List" at the top of your ChartLists box on the "Members" page.
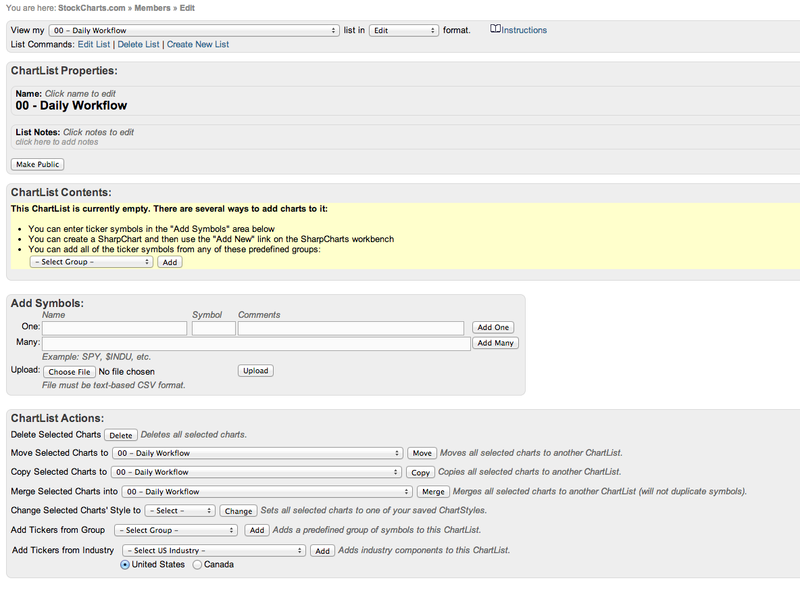
I'll call it "00 - Daily Workflow". I put the double zeros at the front to make sure that it will sort to the top and be my first ChartList. After clicking enter, I end up on this landing page that gives me options on how to populate the new list. Since my list is very specific, I'll need to call up each chart and save it to the list, so I won't use this page this time.
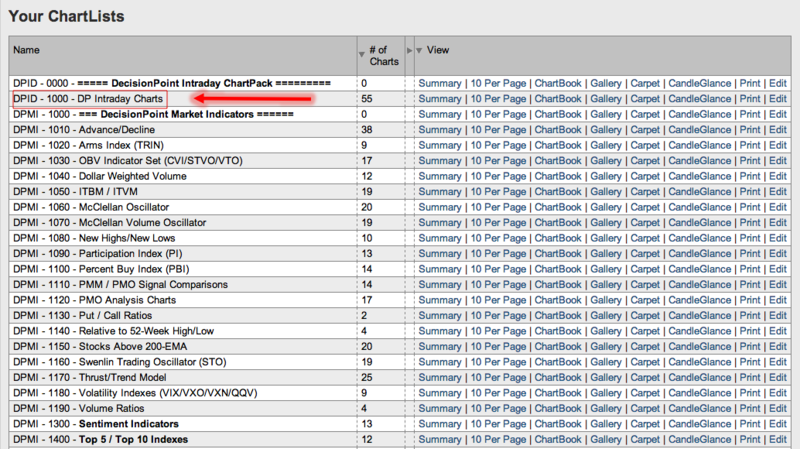
The first chart I need is the 10-min bar chart for the SPX. I know that chart is already pre-created and is a member of the DP Intraday ChartPack. So I go to the Intraday ChartList.
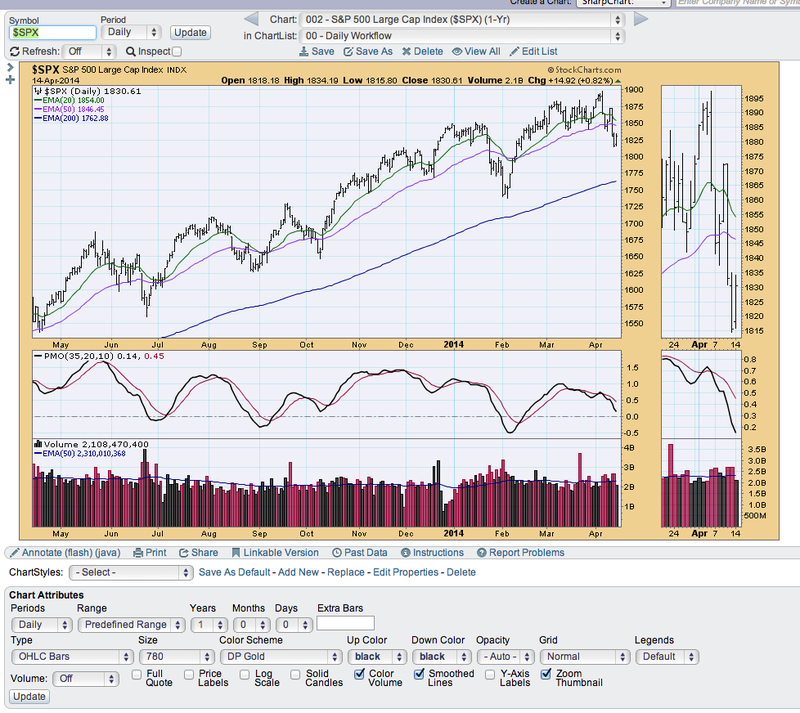
I find and click on the S&P 500 intraday chart.
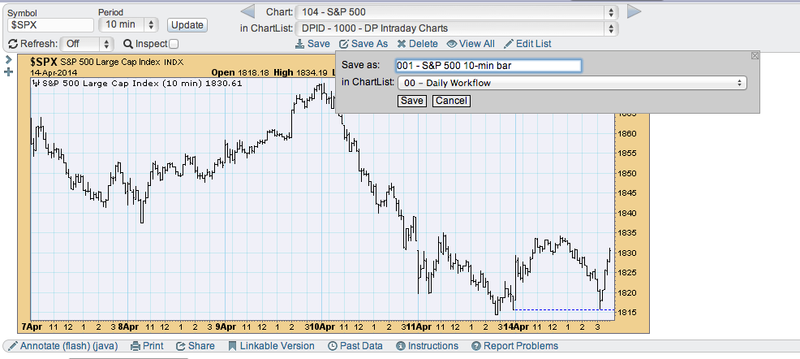
After the chart is opened, I need to save it to my new ChartList "00 - Daily Workflow". So I click on "save as", select the ChartList and then name it. I chose "001" as the start of the name to ensure it shows up first within this ChartList.
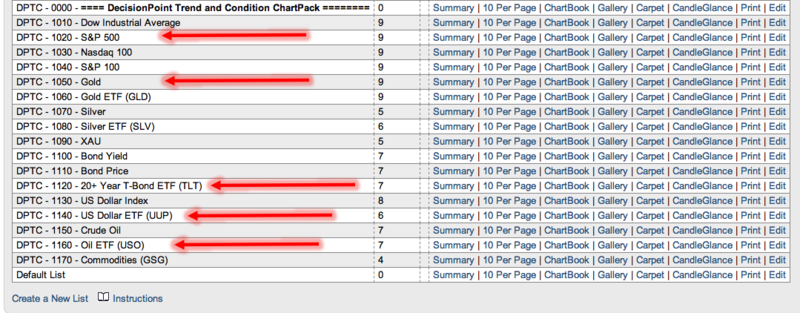
Now I need to find my next couple of charts. The SPX daily, weekly and monthly as well as the Gold, UUP, USO and TLT charts are in the DP Trend and Condition ChartPack, so I can open them from there.
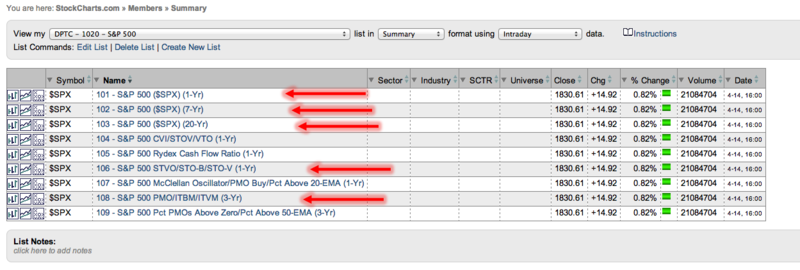
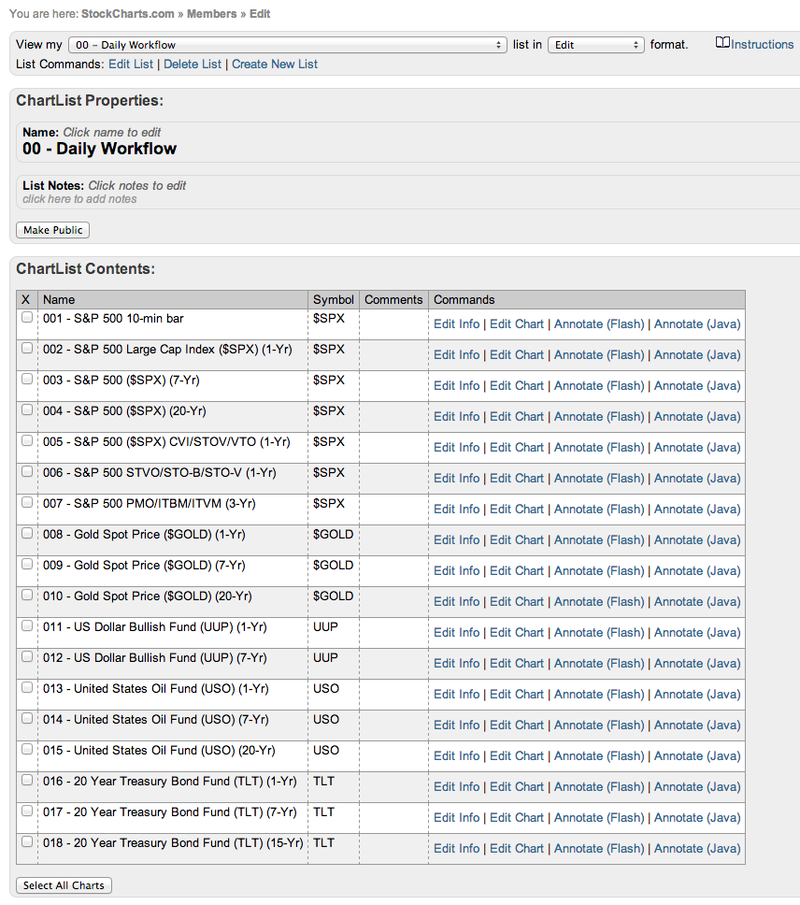
Within the "DPTC -1020-S&P 500" ChartList I see that the next group of charts are ready to go. I open each and following the procedure above, I save each in my new "00 - Daily Workflow" ChartList, making sure to name them in order "002" "003" etc. so that I can preserve the order that I like to review the charts in.
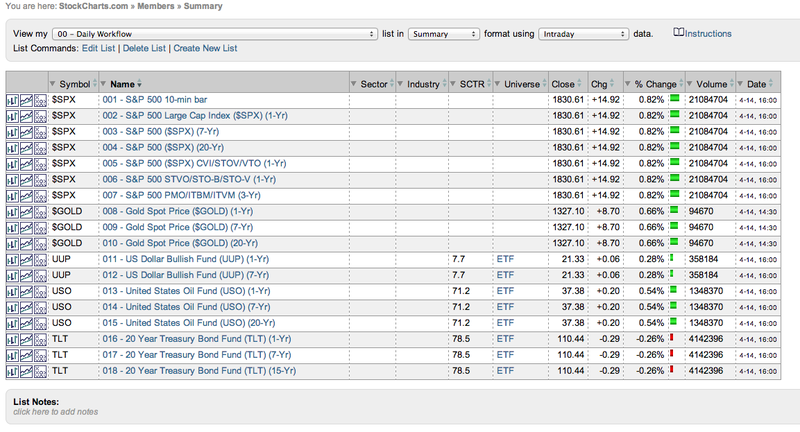
Once I've opened and saved all of the charts in my workflow, the completed "00 - Daily Workflow" ChartList summary looks like this:
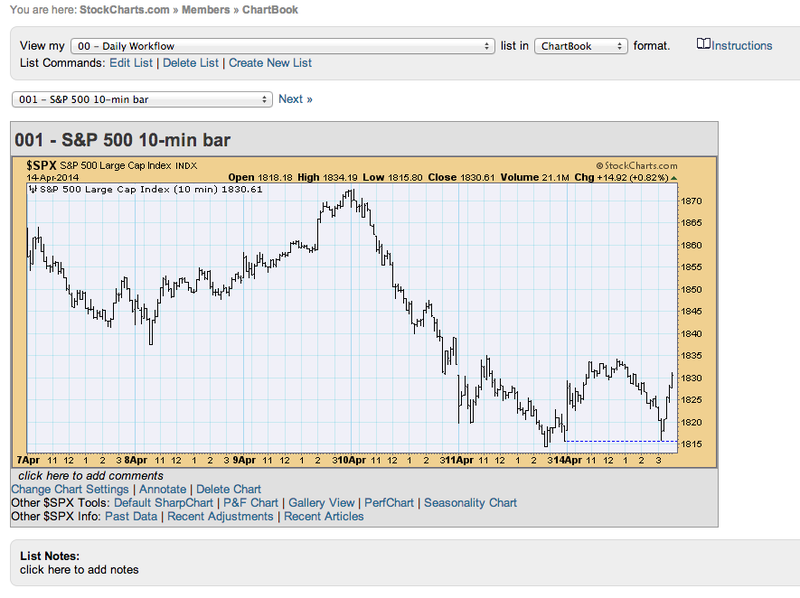
Now I can choose to view this list in ChartBook format and click through each chart quickly to do my regular analysis each day.
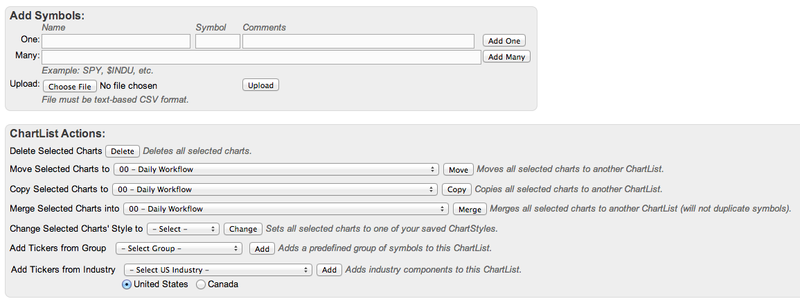
One of the other major advantages to creating a specialized workflow ChartList is that I can make annotations on these charts, save them and view them everyday with those annotations which will update along with the chart. Later if I want to add or subtract charts from my workflow ChartList, it is easy to do in the "edit" ChartList mode:
Creating specialized ChartLists will help you to easily find the charts you like to look at daily. It may seem difficult and time-consuming, but it doesn't have to be. If you look at the same charts almost everyday, you are already calling them up or maybe have them created in another ChartList. I find that quantifying your daily routine on paper first will make creating the workflow ChartList much easier.
A workflow ChartList will keep you focused on what is most important to you and will likely improve your analysis technique in the process.
Happy Charting!
Erin


