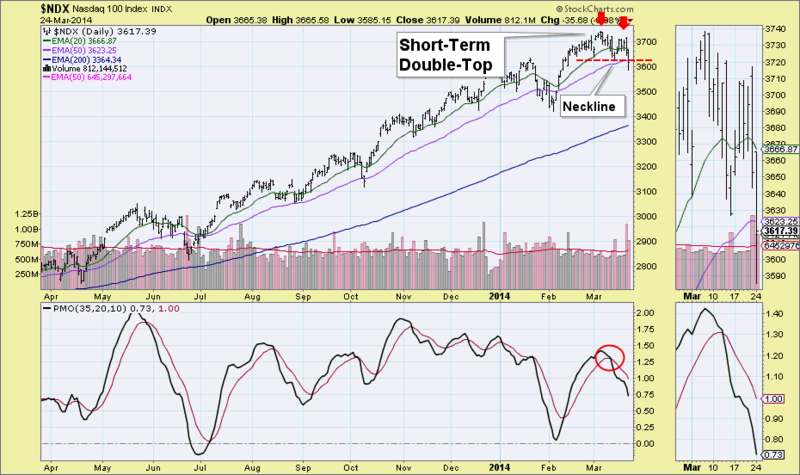
When I reviewed the DP Chart Gallery today, one chart caught my eye. The daily bar chart for the NDX had a clear short-term double-top formation that executed today. While I have seen possible double-tops shaping up on the other indexes, this one stood out because the neckline had been violated and price, while it had attempted a rebound during the day, had not made it back above. Additionally, the PMO had a negative crossover its EMA at the price bottom that marks the neckline of the double-top. What is concerning is that after the negative crossover, momentum never shifted back up during the climb that ended in the second top
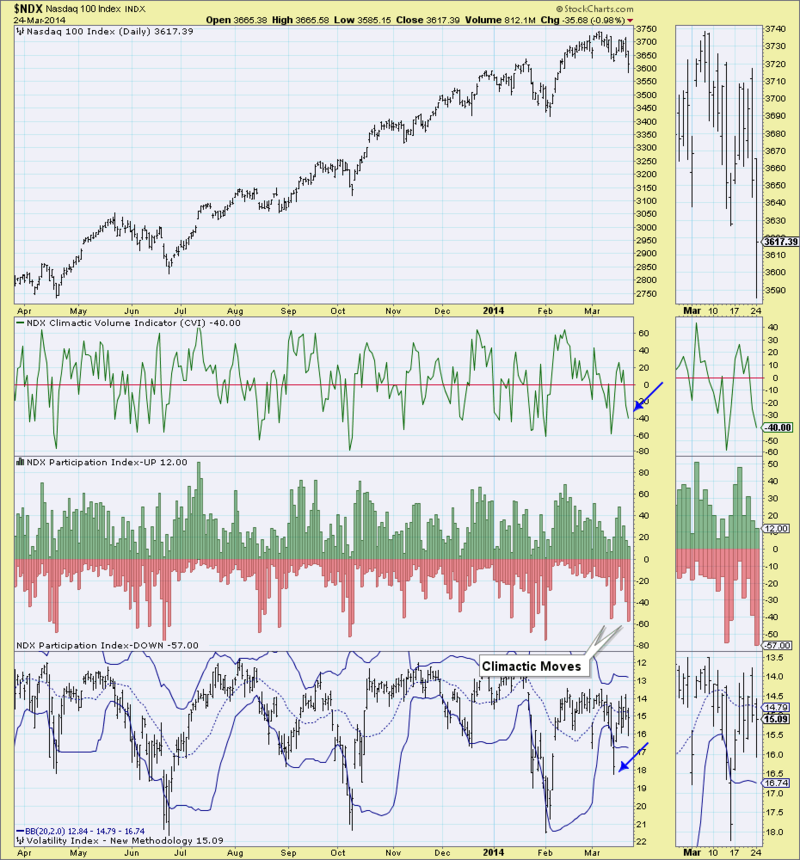
After seeing this chart, it was time to make my way down the DP Chart Gallery and see if there were any indicators that had something to add. The Volatile Short-Term chart shows a climactic move on the Participation Index - DOWN. Climaxes can mean one of two things, it is a price exhaustion or an initiation to a price move further in the current direction. The first climax was an exhaustion, it marked the end of the first pullback. I'm not so sure about this second one, but I note that the CVI and the VIX didn't reach the oversold readings today that they reached on the previous climax.
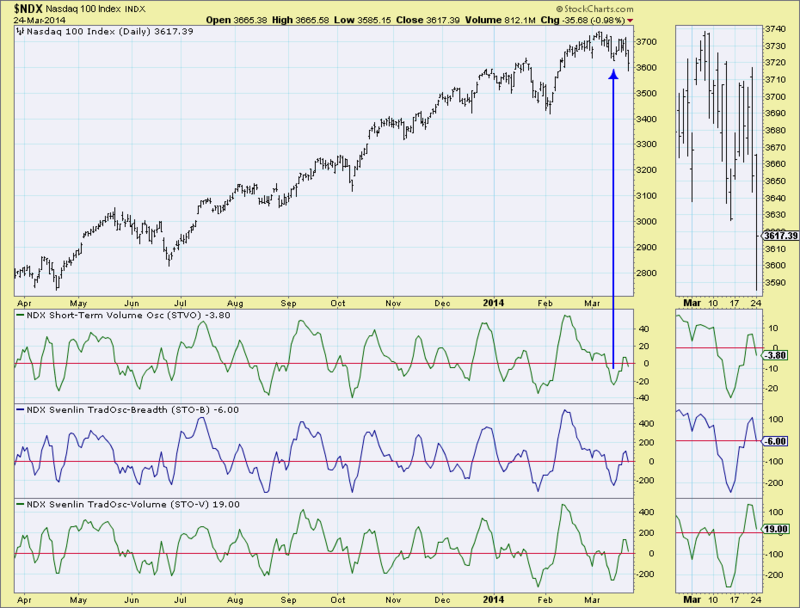
The Short-Term condition chart of the STVO, STO-B and STO-V, show those indicators are falling. They are neutral right now and not in the same oversold territory they were in at the previous price bottom.
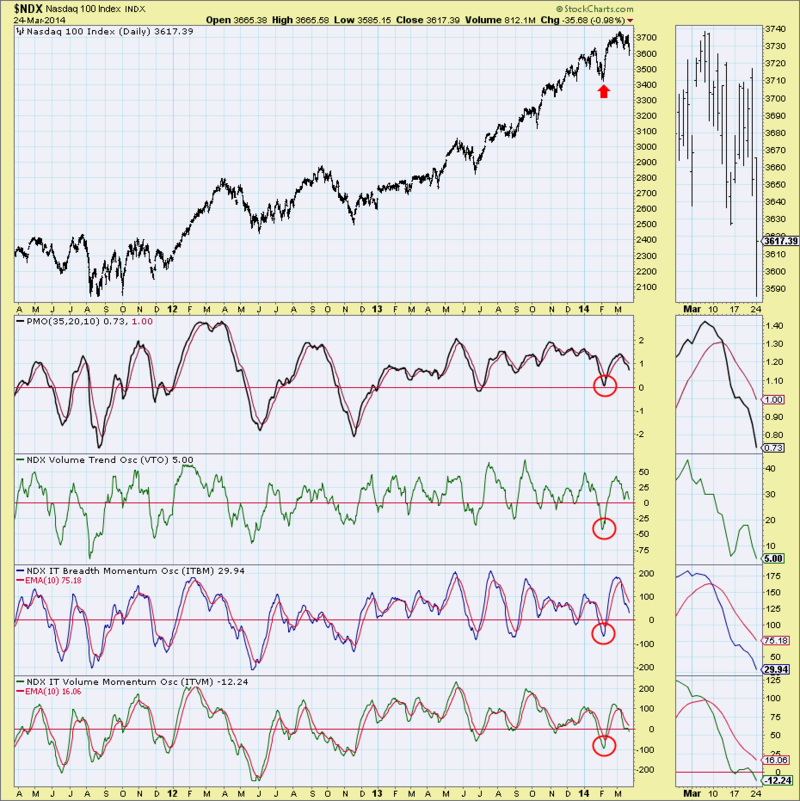
The intermediate-term chart wraps up the package. The ITBM and ITVM are both falling after topping below their EMAs. All four indicators are in neutral territory, no where near oversold. I note that the last oversold bottom on all four indicators occurred after the last large correction.
The double-top price pattern is bearish. The neutral and falling indicators paired with an ultra-short-term climax on the Participation Index - DOWN are also bearish. Many of the other index charts don't have quite the same negative set-up as the NDX right now, but as we know, one index can lead the others down the same path.
Happy Charting,
Erin


