Having basically "grown up" using the DecisionPoint.com website charts, it was critical to me to create these ChartStyles on Stockcharts.com as soon as I could. If you really like these DP ChartStyles, you can copy them from this blog and I'll show you how to save them as your own. If they are almost what you want, we will look at how to customize them before you save them.
Before we get started...login to your account! That way you will have access to all of the features I'm going to show you.
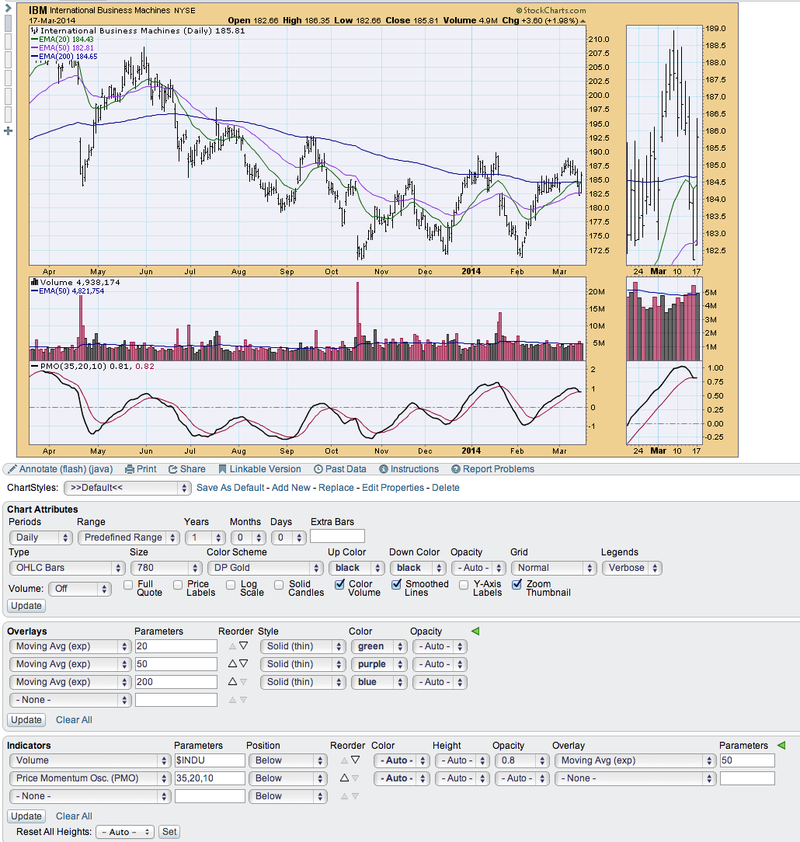
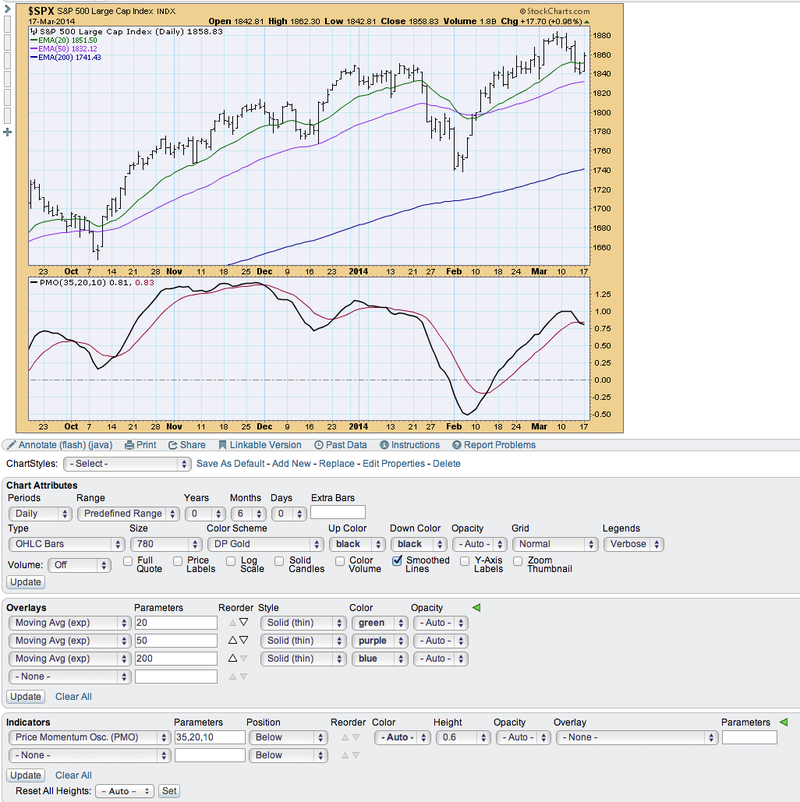
The general DP ChartStyle is the daily chart. This style is used when you type in a stock or other symbol and want to get the basics. This was the default for our ChartTool. At DecisionPoint.com all of our charts have the Price Momentum Oscillator (PMO) and volume in red and black where available, in addition to the EMAs that are used for DP Trend analysis. They are one year charts. I have made this particular style my default.
Click on the chart above and you'll see the screenshot above. If you want this as your "default" ChartStyle, click on the "Save as Default" link under the chart, next to the ChartStyle dropdown. As your default, you will always get this when you open a new chart, open charts from a scan, etc.
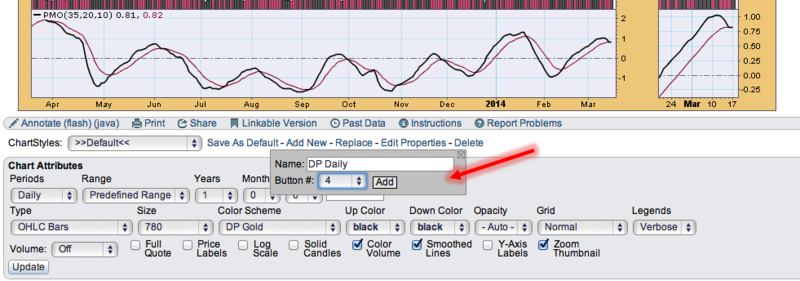
If you like it, but don't want it as your default, click on "Add new". You will have the opportunity to name it ("DP Daily" might be a good name) and add a Style button for it.
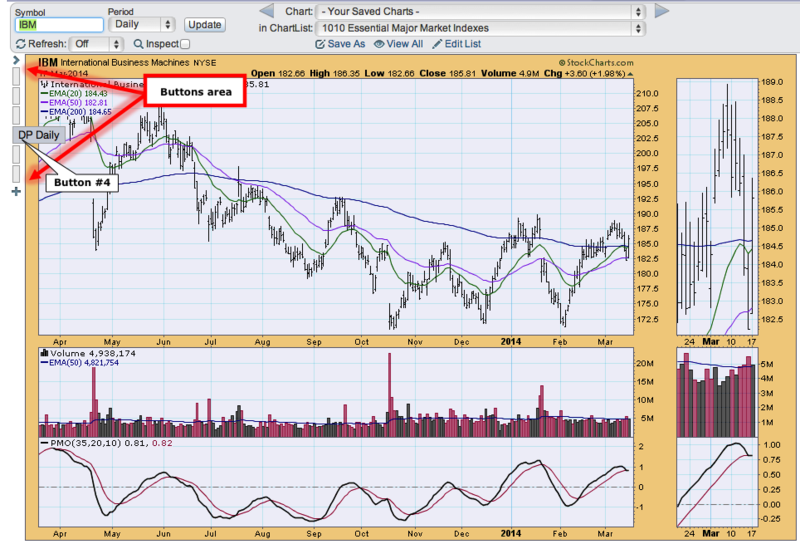
If you think this is a style you will use often (and you didn't save it as your default), you should create a button for it. That way you will have easy access to it and be able to switch to it quickly.
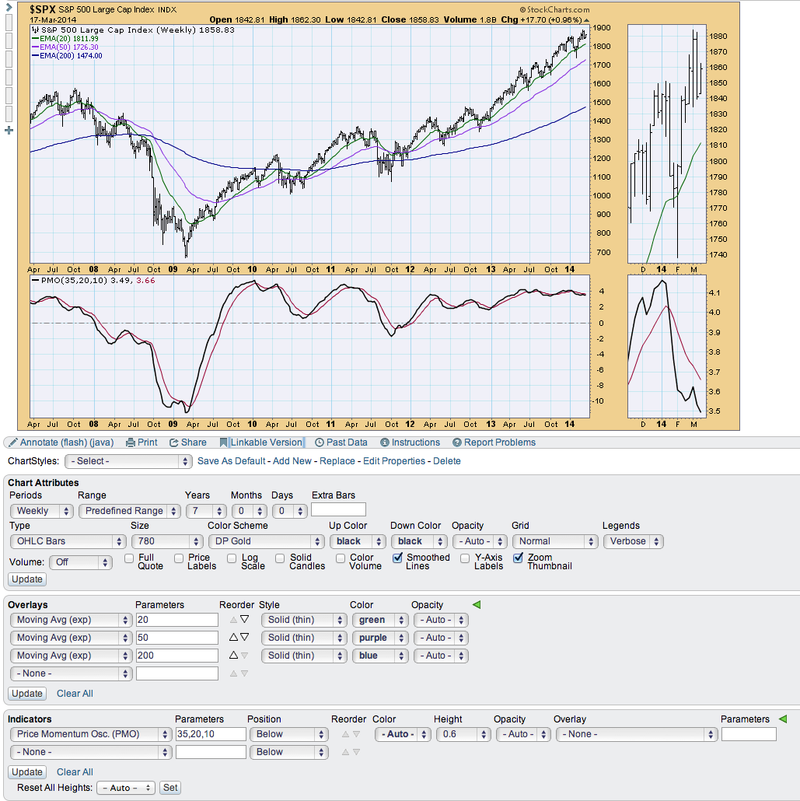
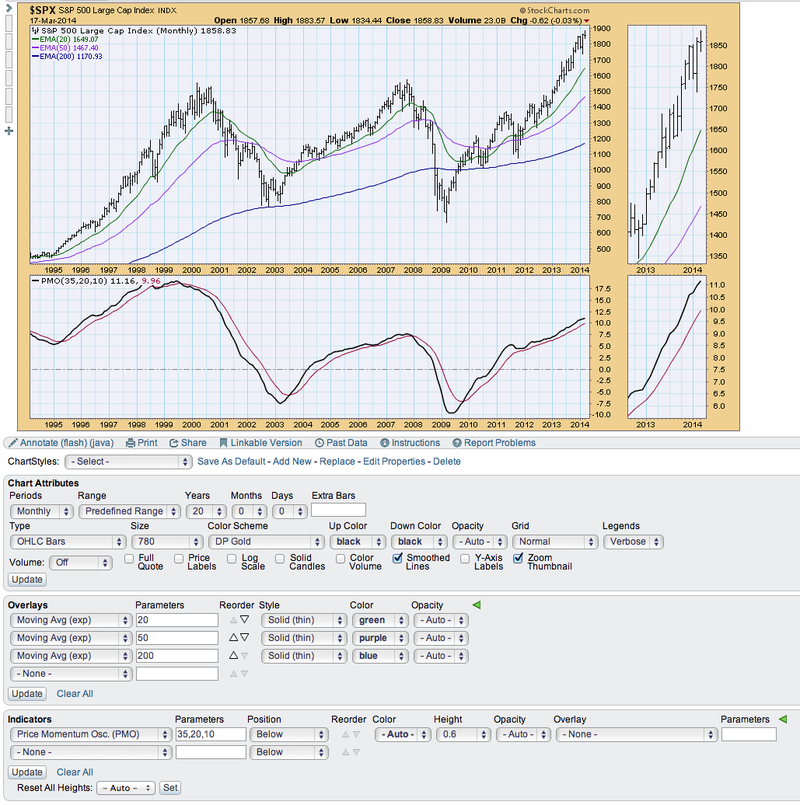
The other DP ChartStyles I use frequently are the weekly and monthly views. While it is easy enough to just choose weekly or monthly from the drop-down, I prefer certain time frames that are not necessarily the 'fill the chart' defaults. Additionally, I do not need volume and I want the PMO window to be taller. Here are those views. Remember, you can click on the chart and add these ChartStyles using the instructions above. I do recommend saving them into a 'button' for quick changes.
Weekly:
Monthly:
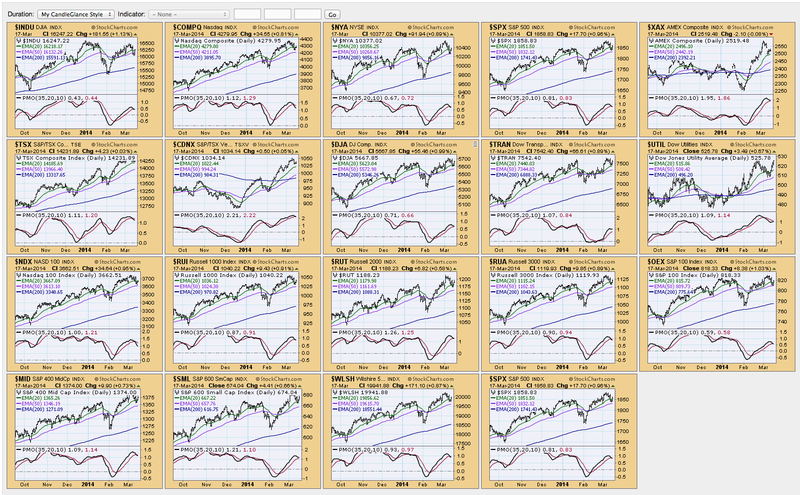
The last DP ChartStyle I have saved is my CandleGlance version. I have chosen it to give me the look of the old DecisionPoint.com "ChartBooks" view. It is basically the daily chart, but I have changed the time frame, taken out the thumbnail and volume and increased the size of the indicator pane. Below I have a link to what a single CandleGlance chart looks like. If you want this as your "CandleGlance" default, you click "add new" and it must be named "CandleGlance" for it to work.
Now when I click on "CandleGlance" view for my ChartLists, this is what I see:
If any of these ChartStyles aren't quite what you want, you can change the parameters to match your 'style' and then save the ChartStyle either as your "Default" or just a separate ChartStyle using the "Add New" link.
I find the DecisionPoint ChartStyles to be clean and a great starting point for my analysis. For DecisionPoint.com subscribers these styles make the unfamiliar SharpCharts workbench feel more like home. Try them out and if you have more questions about saving and creating ChartStyles, try clicking here to view a video that walks you through it realtime.
Happy Charting!
Erin

