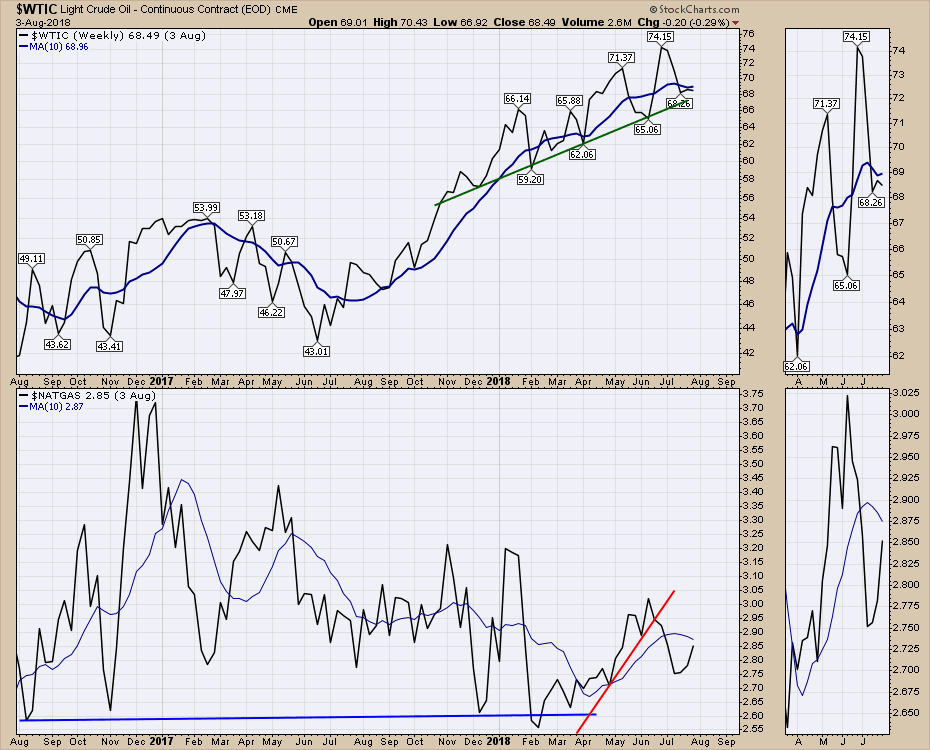
Most of the commodities traded within their range of the last month. Wheat and corn were the exceptions. The $USD pushed to its highest weekly close but still trading in the range around 95. The energy markets all traded below their 50 day moving average to close out the week. Industrial metals had a mixed week but no real price direction of significance.
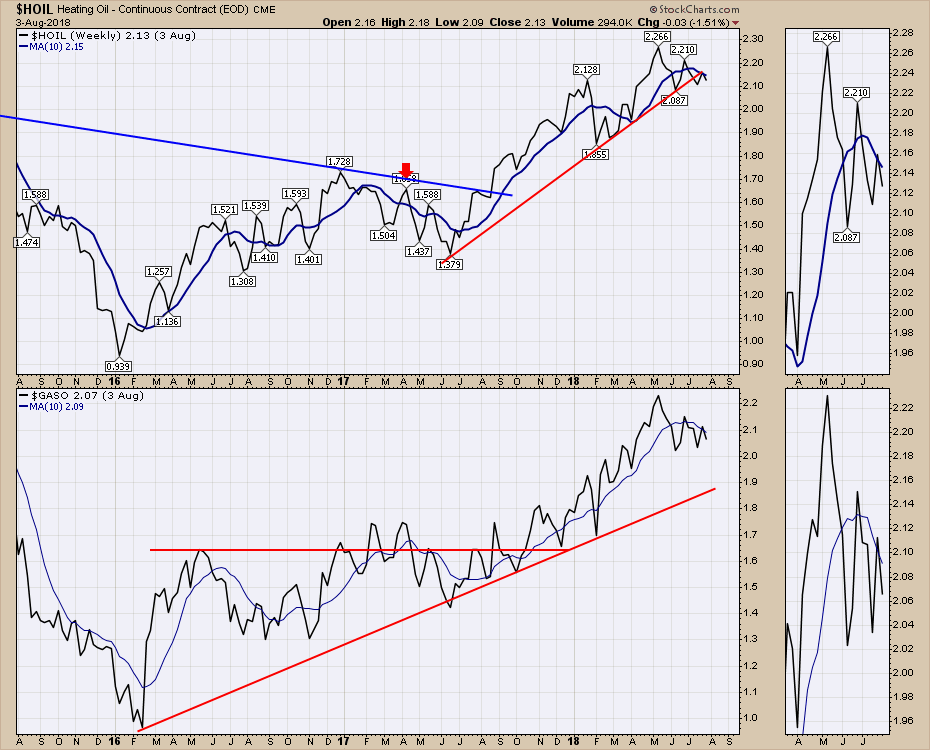
Here are the heating oil and gasoline charts.
Just a reminder, I am the opening speaker kicking off Chartcon 2018 on Friday morning, August 10th! DON'T BE LATE! I hope to be one of the strongest presentations to kick this off. While I love the SCTR, my presentation this year will be a totally different method of simply finding great set ups based on some of the biggest names in Technical Analysis. I am up against some fabulous speakers so I have my work cut out for me.
Seriously, when do you get to hear published authors Martin Pring, David Keller, Greg Morris, Alexander Elder, John Murphy, Arthur Hill, Tuchar Chande, Gatis Roze, and Greg as just part of the roster? People have crossed the world to listen to some of these presenters. I could list the full speaking roster here but its unbelievable! Follow this link to check out the entire list. Register right away so you get all of the information regarding how to optimize the software and the Chartcon guide.
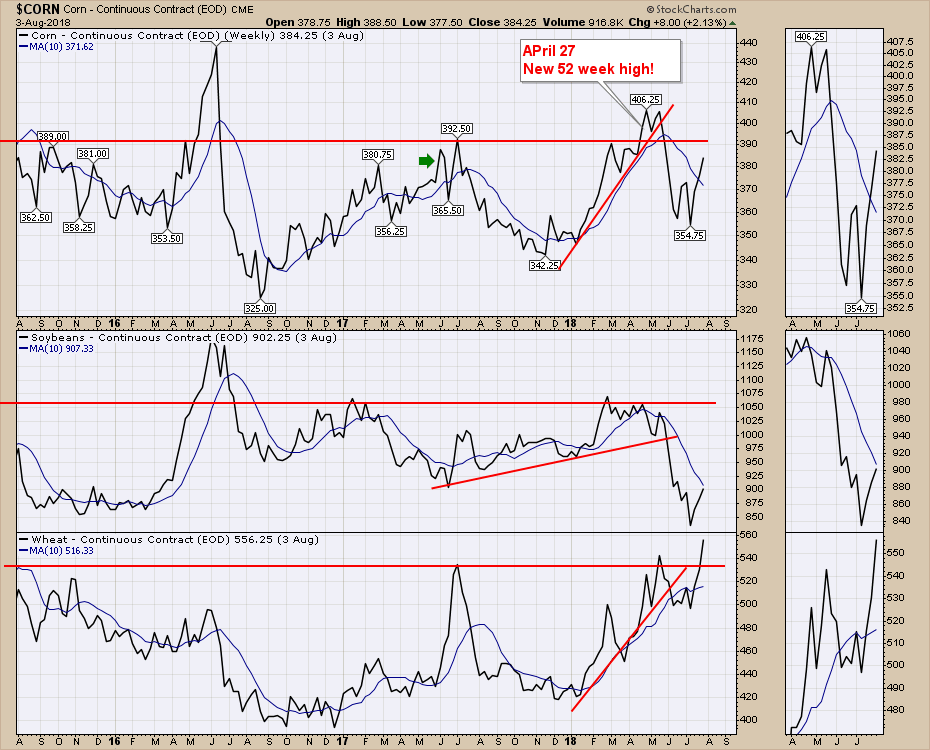
One area within commodities that had a good week was the Corn, Soybean, Wheat group. Trade tensions have created some moves.
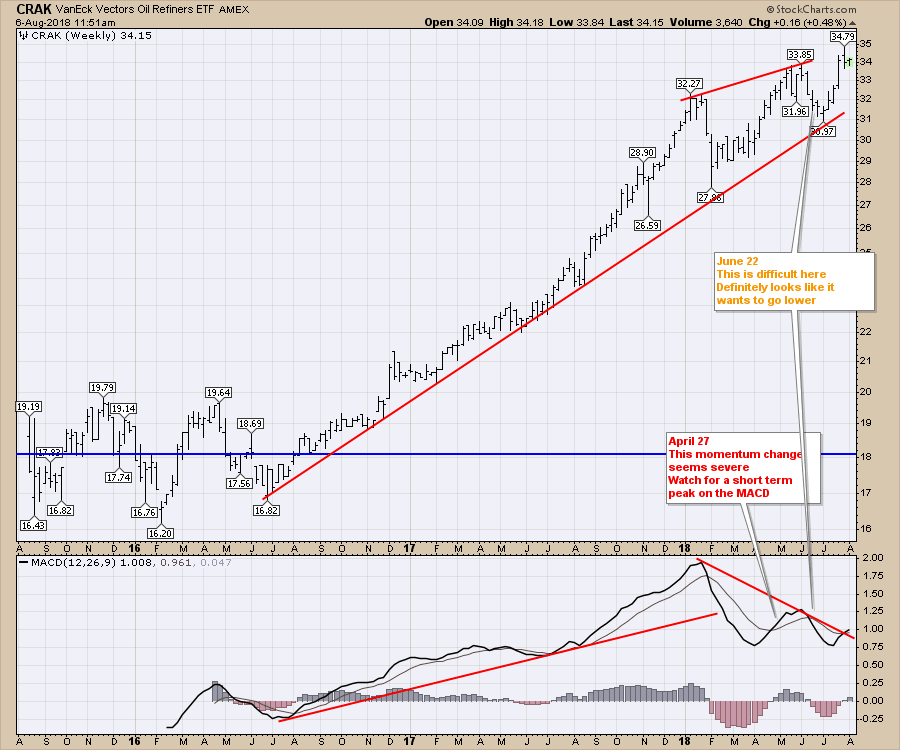
 One chart that is testing highs right now is the CRAK ETF, for the oil refiners.
 There is lots more in this weeks video!
Below is the Commodities Countdown video that walks through the commodities set up right now.
Below is the recording of The Final Bar show I mentioned above. As Apple moved above the trillion dollar market cap, the $INDU chart closed down on the day. This led into a discussion about examining the underlying price action and how to quickly create index chartlists with just a few keystrokes.
Below is the recording of The Canadian Technician Video. This video shows some great examples of how breadth breaks down before the markets weaken.
Don't forget to register for Chartcon 2018.
If you are missing intermarket signals in the market, follow me on Twitter and check out my Vimeo Channel often. Bookmark it for easy access!
Good trading,
Greg Schnell, CMT, MFTA
Senior Technical Analyst, StockCharts.com
Author, Stock Charts for Dummies
Want to read more from Greg? Be sure to follow his two StockCharts blogs:
Commodities Countdown and The Canadian Technician