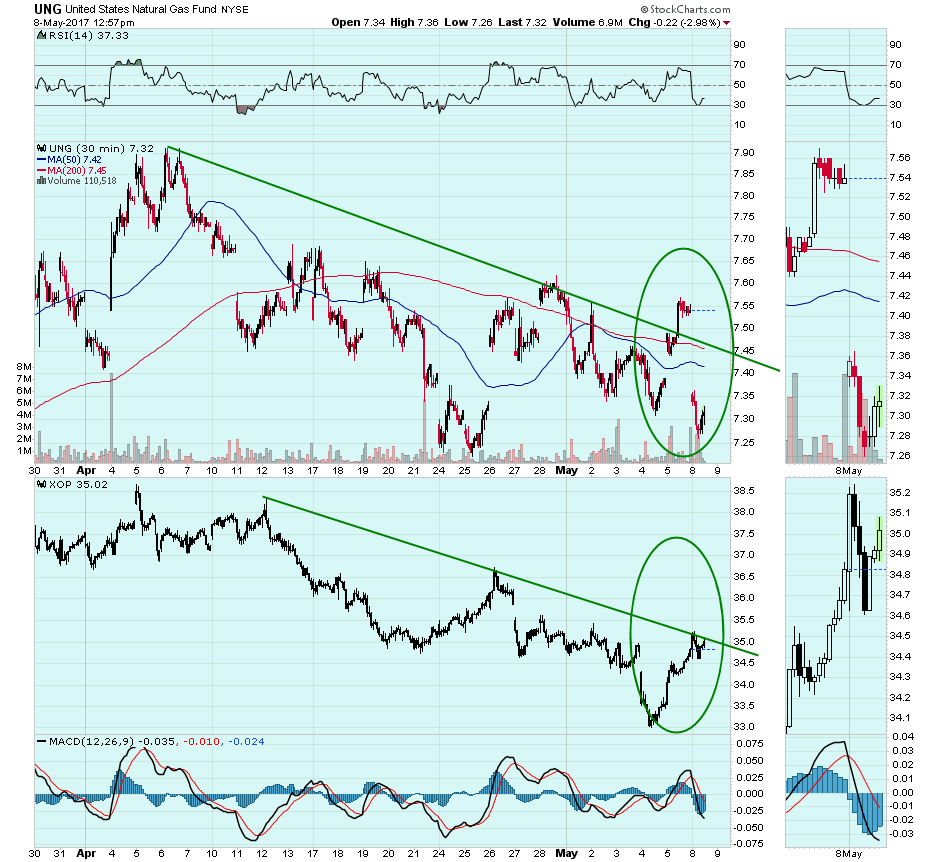
Natural gas was picking up a bullish tone on Friday as it tried to move up to the top of a 2-week trading range. However, Monday moved it back down to the bottom of the range. The typical Natural Gas stocks did not follow the move back down to two weeks lows at the time of writing. I'll just use XOP for this chart.
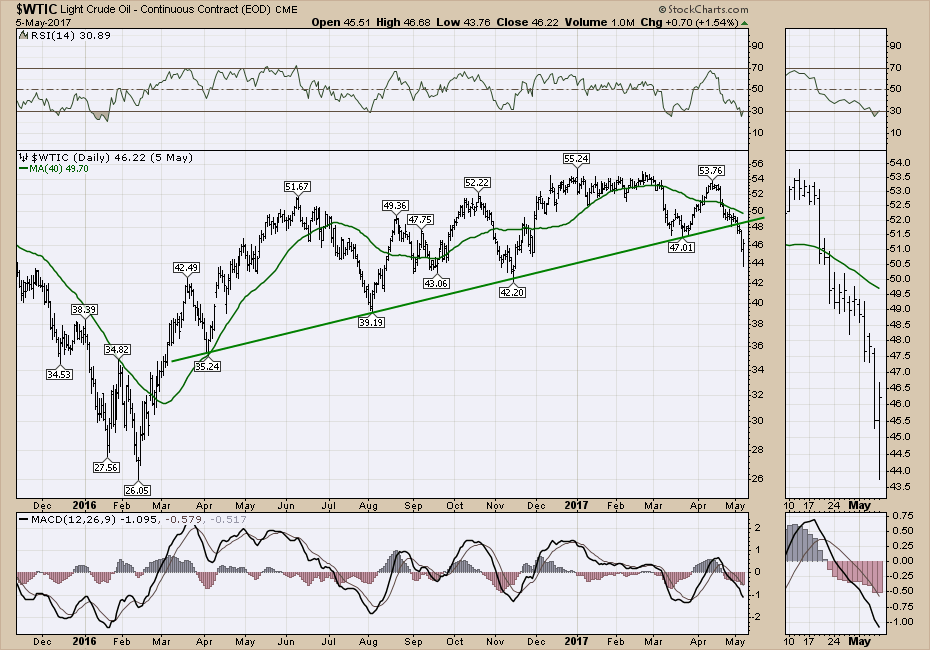
Oil broke 1-year trendlines last week with a big down candle Thursday.
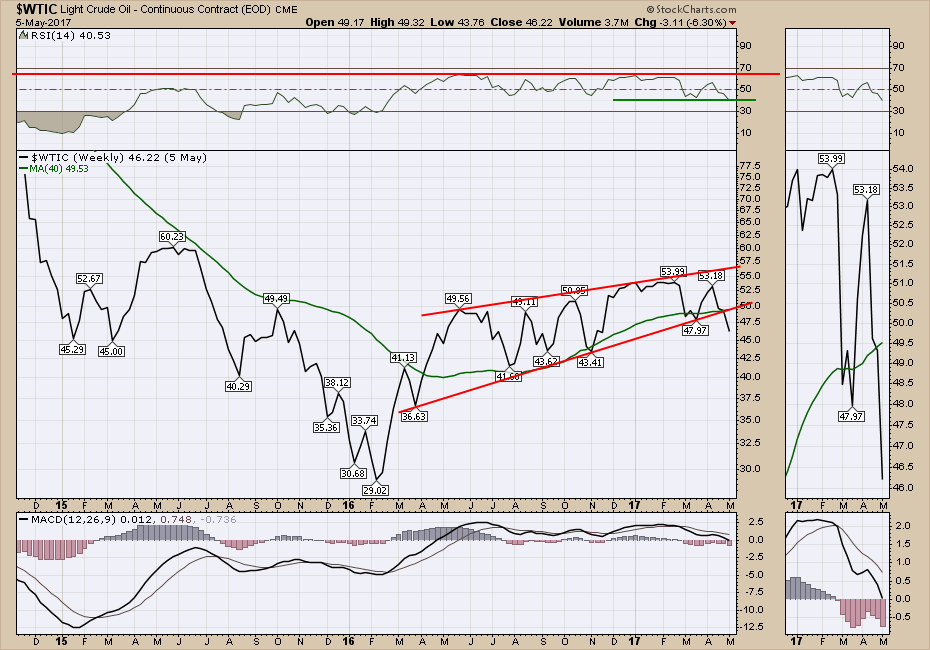 On Friday it created a hammer candle and all of the energy stocks soared.
 Monday gave back most of the bounce in oil but the energy stocks have not followed the pullback at the time of writing. These divergences could mark the bottom of this one-month downtrend.
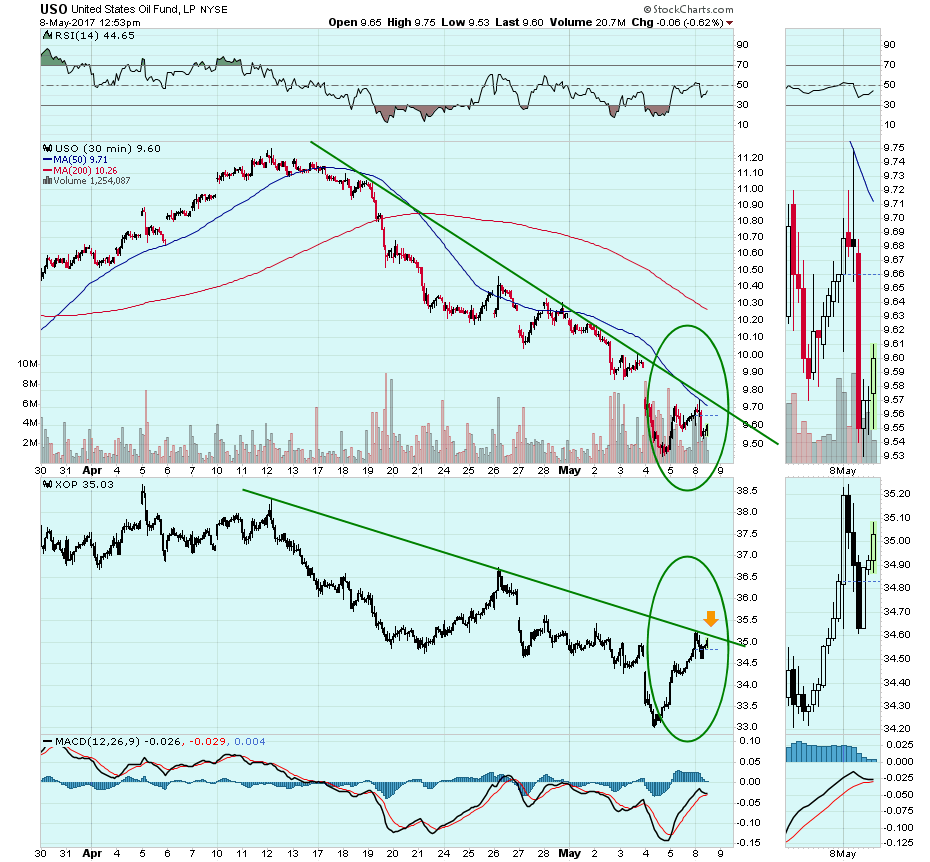 This might mark an end to the big oil and gas companies selloff, or the rally might just die at this trendline and start to accerate from here. It's an important place to pay attention!
Good trading,
Greg Schnell, CMT, MFTA