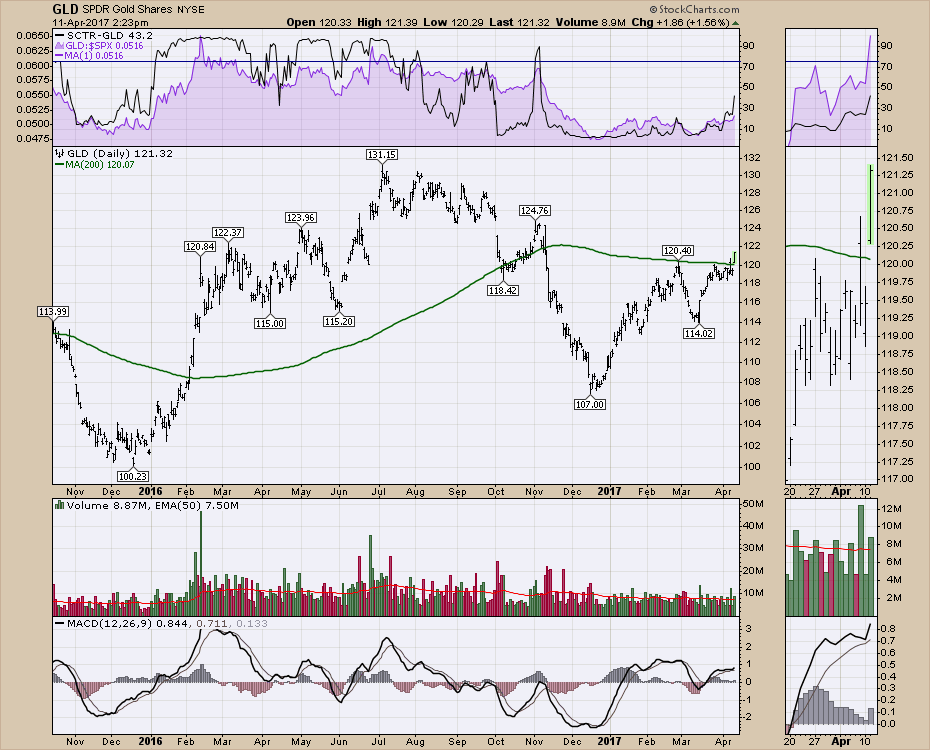
Yesterday, I wrote about how Gold was just drizzling along. This morning, Gold jumped on the open and continues to soar. Currently at the time of writing, Gold is at 1275 and running. The GLD chart shows the move intraday. Looking inside the zoom box panel on the right, this is the start of the move I thought we might get a few weeks ago.
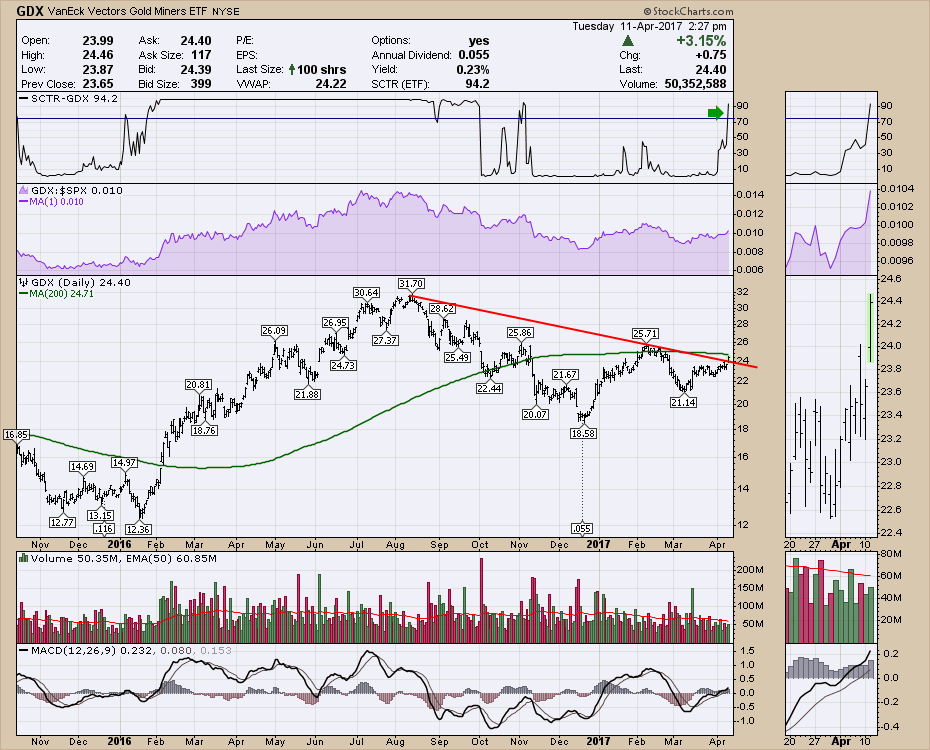
Here is the GDX. Look at the soaring SCTR. This bodes well for a continuation move. I mentioned on the Canadian Technician video last week that there were a lot of Gold related stocks moving into the top performance area on the SCTR ranking. This breakout would confirm what the SCTR was telling us.
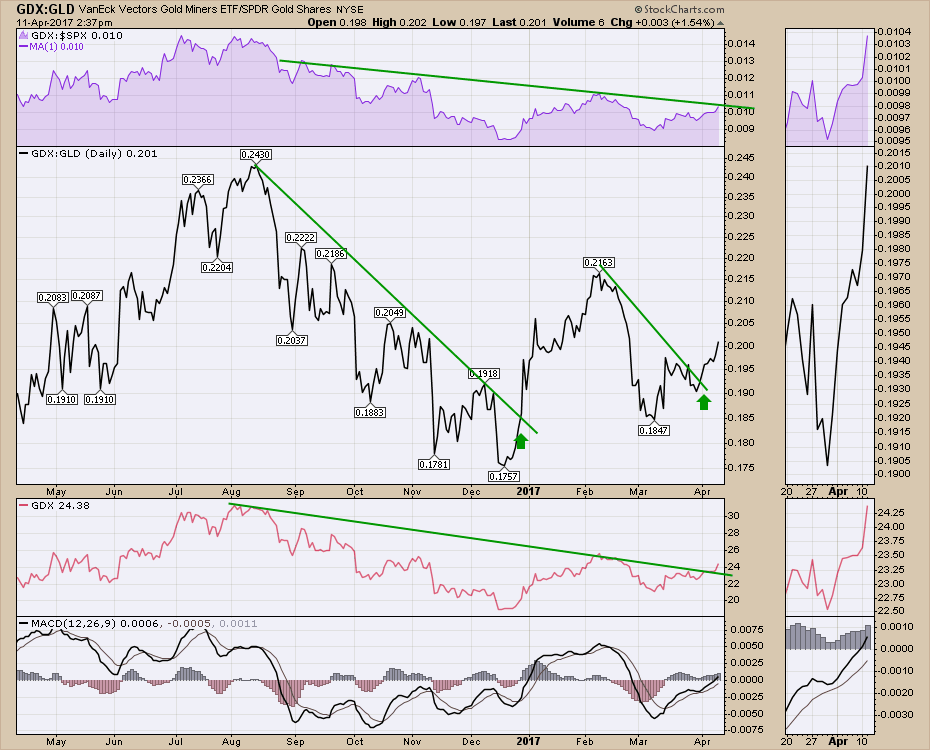
 When GDX continues to outperform GLD, this is usually a sign for a good move in both GLD and GDX. Using a ratio chart below (GDX:GLD), we can see that starting to happen. At the end of March this trend line was breaking, but the actual price moves on both GLD and GDX were pretty low. The nine month trend line break on GDX and the 2-month trend line break on the ratio suggest a good push in the gold miners.
 Good trading,
Greg Schnell, CMT, MFTA