Gold is at a major inflection point on the chart. Technicians of all persuasions will be checking out this chart.
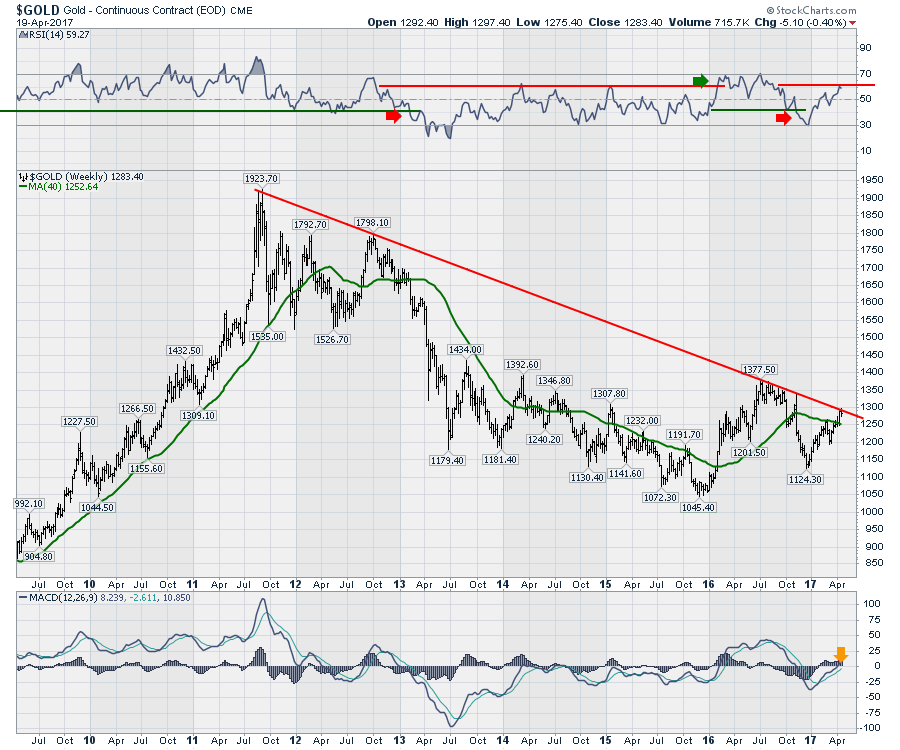
However, there are multiple technical views of the same chart. The RSI on the following chart suggests Gold is back in a bear market. The RSI is at the top level (~60) for a bear market rally. The MACD right at zero doesn't give us any clues.
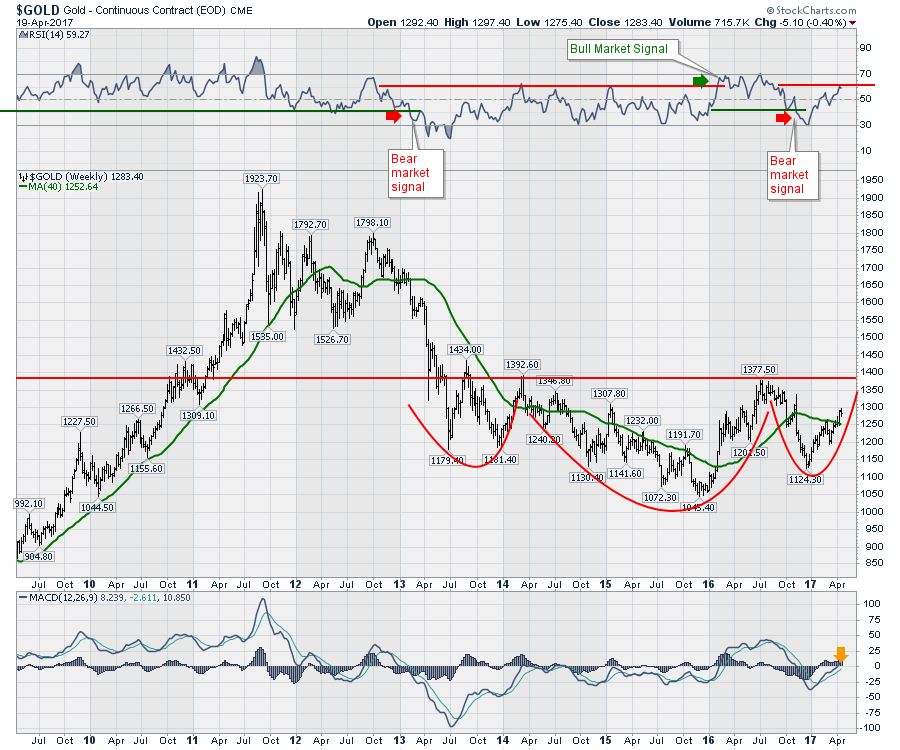
Secondly, a more bullish view shows a typical major base setting up with the head and shoulders base.
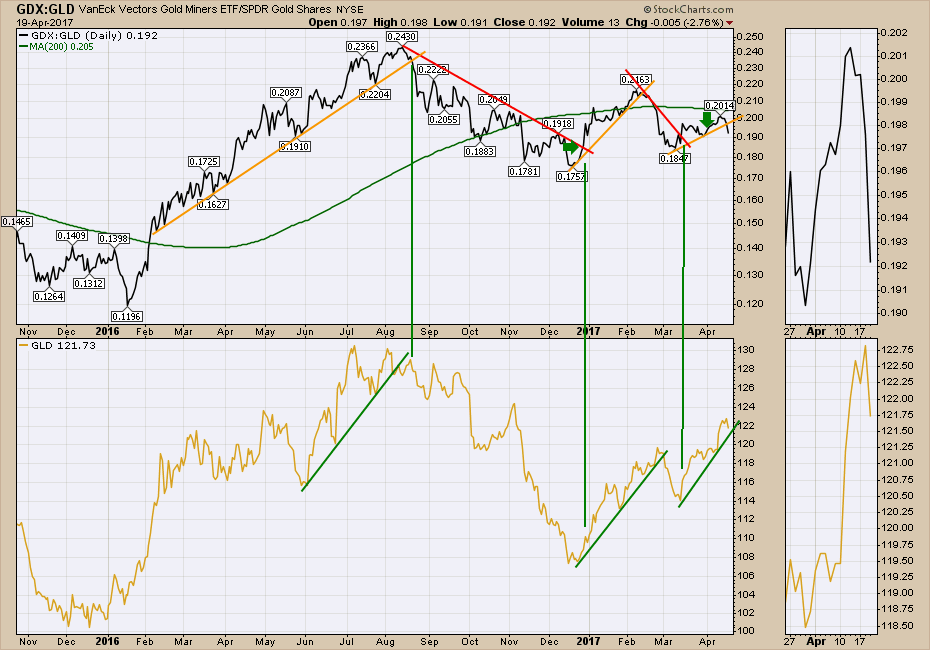
 The bottom line is the Gold chart could rarely be at such a major inflection point. One of my primary indicators is the GDX:GLD ratio. Today this ratio broke down, so I am back on a sell signal. No breakout yet! Arrgh!
 Be sure to check out the Commodities Countdown 2017-04-20 video. I packed a lot of information in it. I think you'll agree the commodities look in serious trouble and the world abounds with resistance.
Good trading,
Greg Schnell, CMT, MFTA.