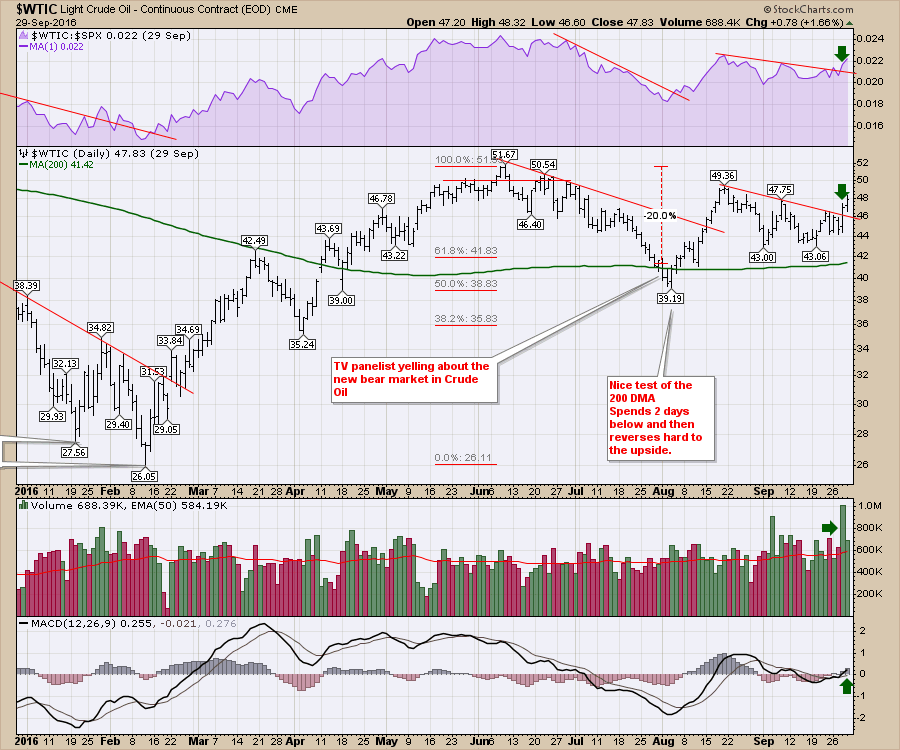
Oil surged this week on the back of OPEC suggesting they might hold back a little production. While the news from OPEC is timely, The chart for Oil (WTIC) shows a lot of stress at this $48 level. One very positive development is a higher short-term high above the $47.75 high. We have been trading $42-$50 since April.
However, that theme of trading sideways is showing up in a lot of the commodities. Copper, Aluminum, Steel, Gold, and Oil have all been range bound for a while now.
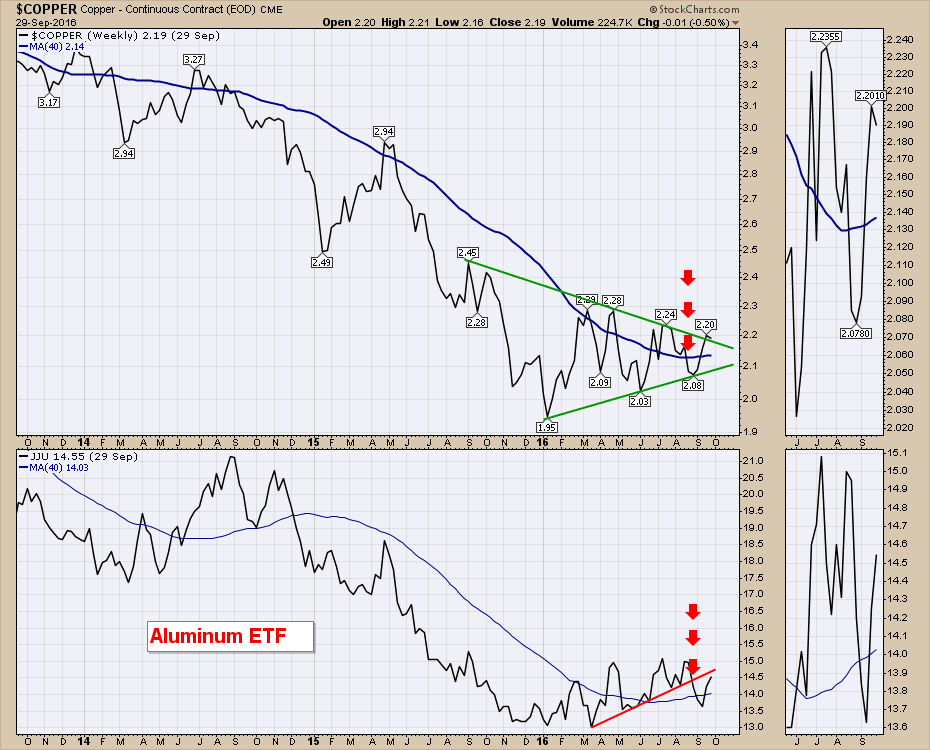
Copper looked weak heading into September but has rallied all month. This pennant on Copper continues to tighten. Aluminum has been trading sideways for 8 months.
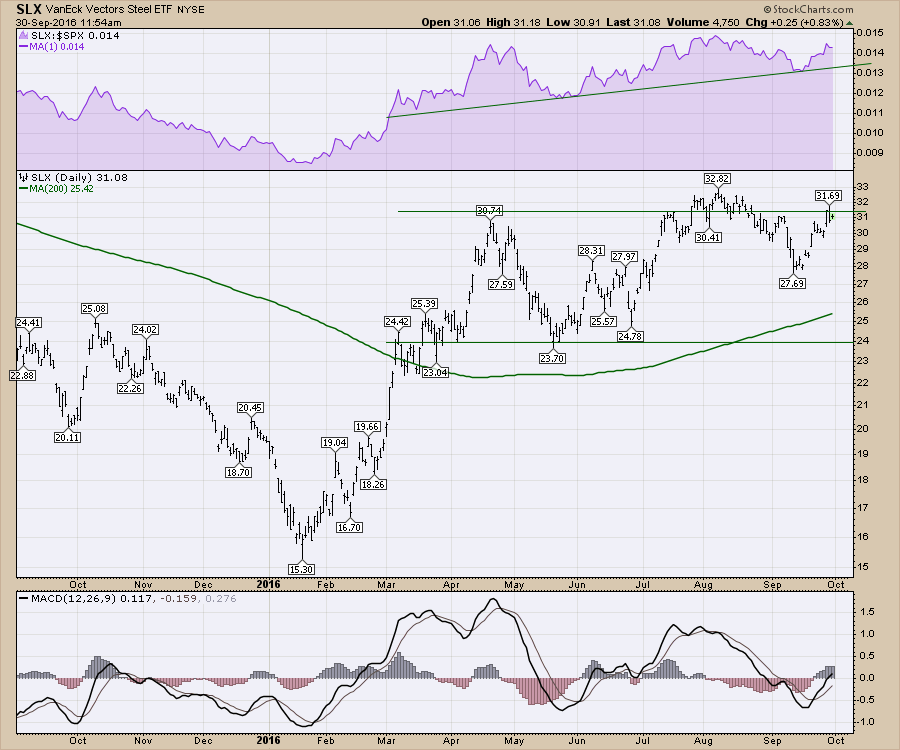
 The Steel ETF was rallying but has moved to a sideways direction. The recent higher low looks good so that is a positive. This $31 level is important resistance. The chart has spent a lot of time between $27 and $31.
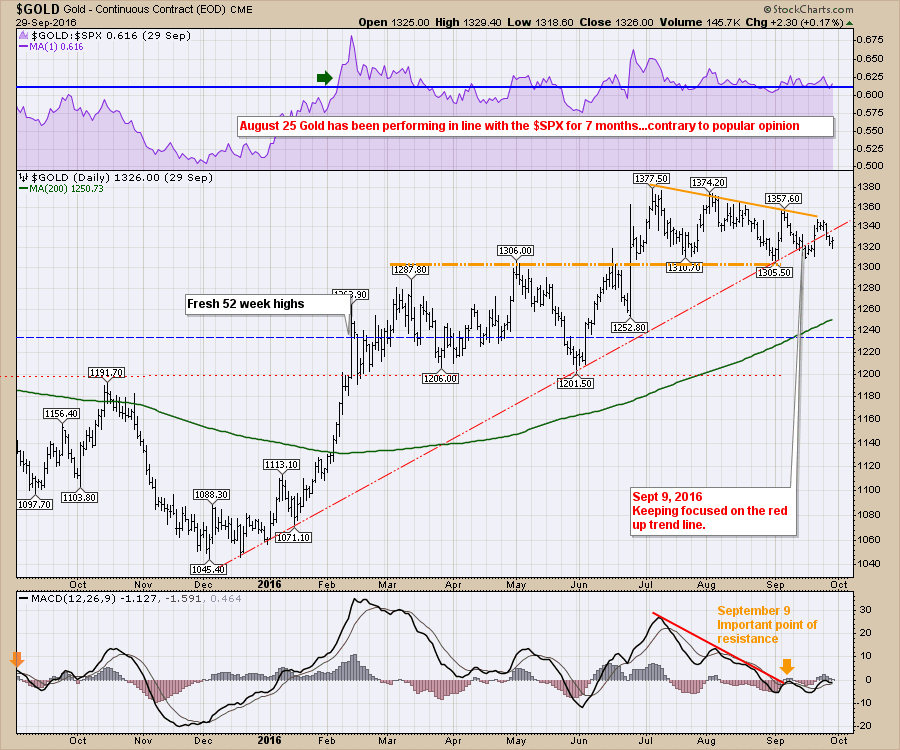
 $GOLD has performed in line with the $SPX since mid-February. The gold miners have performed better. Gold has gone sideways since the Brexit Breakout in late June.
 The bottom line is most of the commodities are tracking sideways. Until we see some breaks in the $USD which has also been range bound, we'll probably continue to be watching without direction.
Here is the link for the webinar. I spent most of the time reviewing the commodities. The last 10 minutes jumps into a wider look at European banks, not just Deutsche Bank (DB). The internet connectivity was poor. My apologies for that. Commodities Countdown 2016-09-29.
Good trading,
Greg Schnell, CMT, MFTA.