Rotation is nothing new during secular bull markets; it's actually what drives bull markets. Rather than money leaving the stock market for another asset class when leading sectors sell off, it simply moves from one sector to another sector. Financials (XLF) recently caught fire as treasury yields rebounded. Materials (XLB) took a turn leading the market higher after retreating back to test its February relative support level. Technology (XLK) and Consumer Discretionary (XLY) had their best moments during 2020. Real Estate (XLRE) suffered through a brutal 2020, but has been a leader throughout 2021. The list goes on and on.
I believe it could be Industrials' (XLI) turn for a couple of reasons.
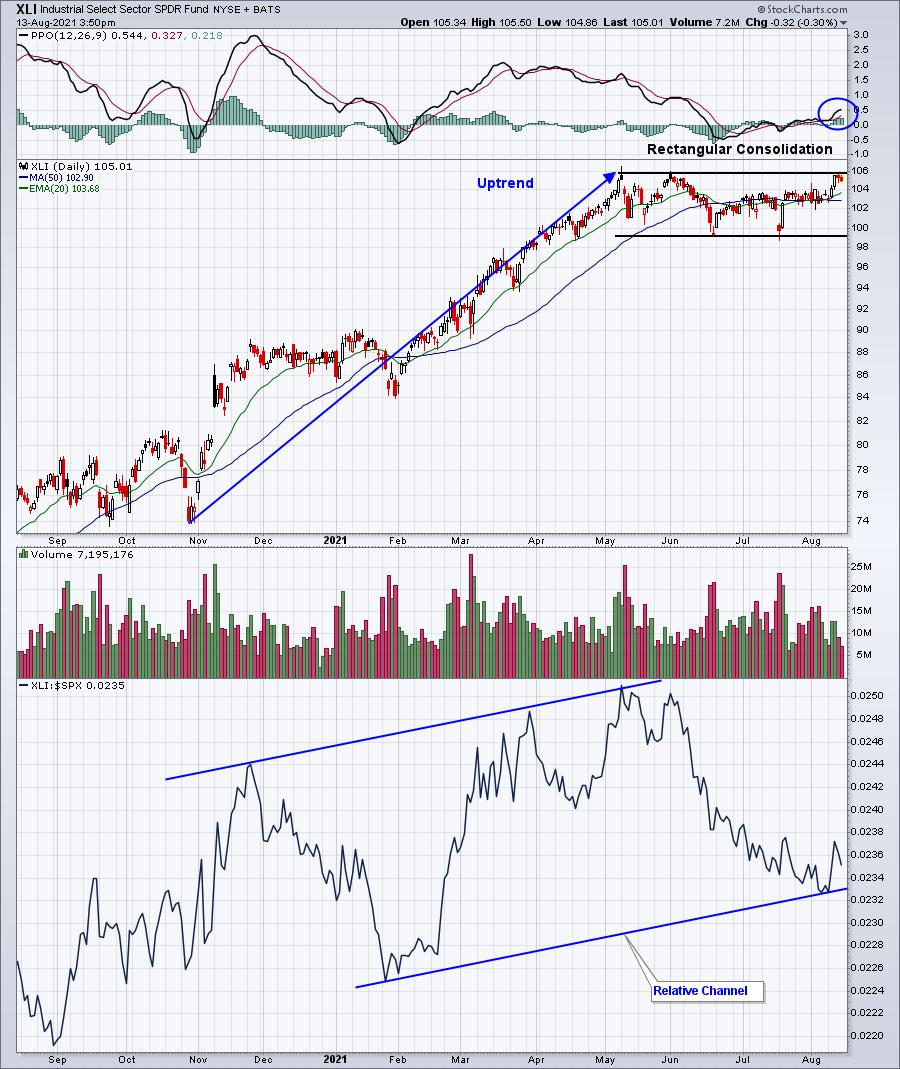
Let's start with the technical reason. The relative strength of XLI turned on a dime when both absolute and relative support were tested. In the case of relative support, it was channel support that was tested. Check out this chart:

Industrials were very weak throughout June and July; price support held when tested in July. Then, in early August, we saw a channel support level created/tested. If the XLI loses the absolute and relative support levels illustrated above, then I'd re-evaluate my sector thoughts. Until then, however, I'd move forward under the assumption that industrials will perform well.
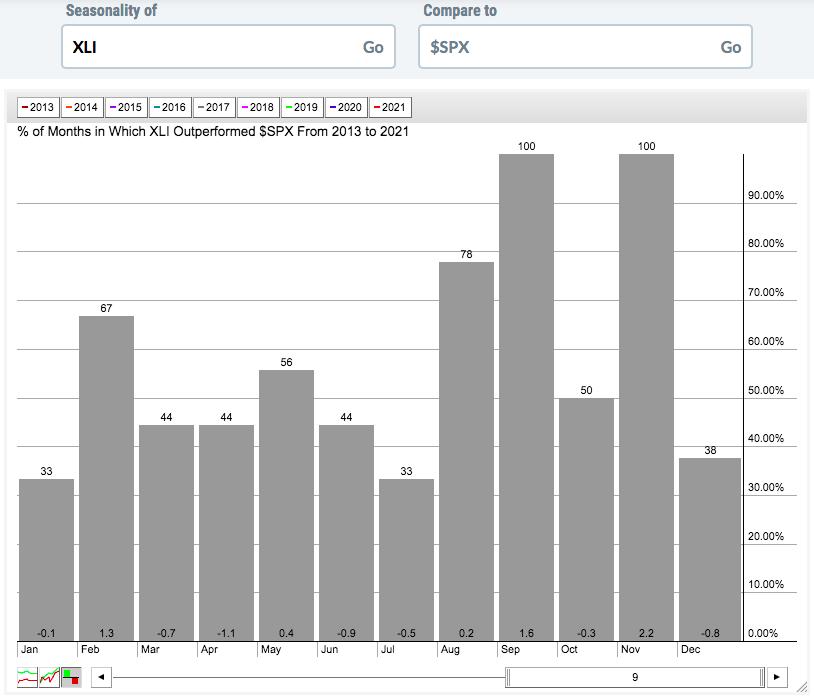
There's another reason why it's time to look at industrials. From a seasonal perspective, the XLI loves the upcoming 3-month period, September through November:

The above seasonality chart shows the XLI relative performance vs. the S&P 500. It's a 9-year lookback period which covers 2013 through 2021. April 2013 is when the S&P 500 cleared its double top from 2000 and 2007, confirming the current secular bull market. Over the past 9 years, I believe it's quite obvious that the XLI loves two of the next 3 months. It's outperformed the S&P 500 every year since 2013 in both September and November. That's a very strong track record and completely supports the technical bullishness in the prior chart.
When I select the 10 equal-weighted stocks in each of our 4 portfolios on Thursday, August 19th, I'll be keeping all of this information in mind. If you're unfamiliar with our portfolios and our selection process, I'll be hosting a "Sneak Preview" event on Monday, August 16th at 4:30pm ET, to describe the process. Our flagship Model Portfolio is up 228% since its inception on November 19, 2018, while the benchmark S&P 500 is up 65.79% by comparison.
The Monday event is completely free (no credit card required). We'll invite all of our free EB Digest subscribers, in addition to our paid members at EarningsBeats.com. If you'd like to secure a spot at our free Monday event, simply sign up for our EB Digest newsletter by entering your name and email address HERE. We'll send out room instructions to everyone on Monday!
Happy trading!
Tom
