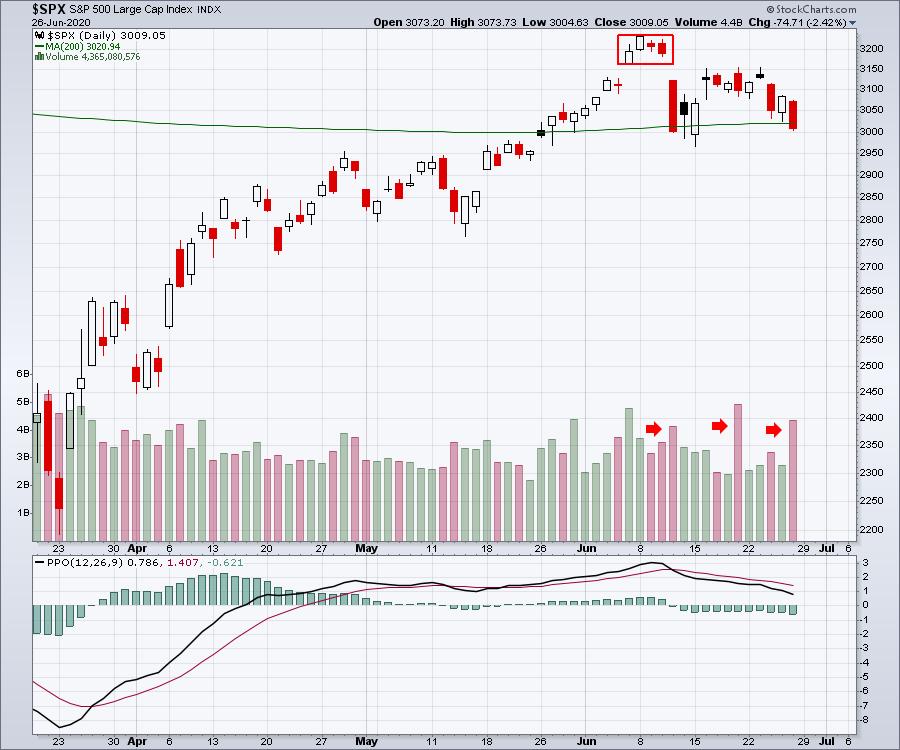
On June 10th, the Federal Reserve held their meeting and the stock market struggled on the Thursday after that, down 5% on the day. My last ChartWatchers article, titled "The End Of The Trend?", suggested that the size of the selling that day might be marking an important trend change.
Looking back this week, we have the benefit of hindsight. We have not been able to get back into the range of what is technically termed an island high. The island was created by a gap up, a loss of momentum, and then a big gap down, trapping all buyers on the island in a losing position. After the Fed meeting, the market dropped lower (big red bar) on big volume. The following Friday was the Quadruple witching Friday, which also has high volume. That volume is common to see on Quad options Friday, but that also marked the high of the rebound. The additional selling on multiple days this week is looking very heavy, as the down volume is outpacing the up volume. When we add the 200-day moving average, we can see the $SPX closed back below it again this week.

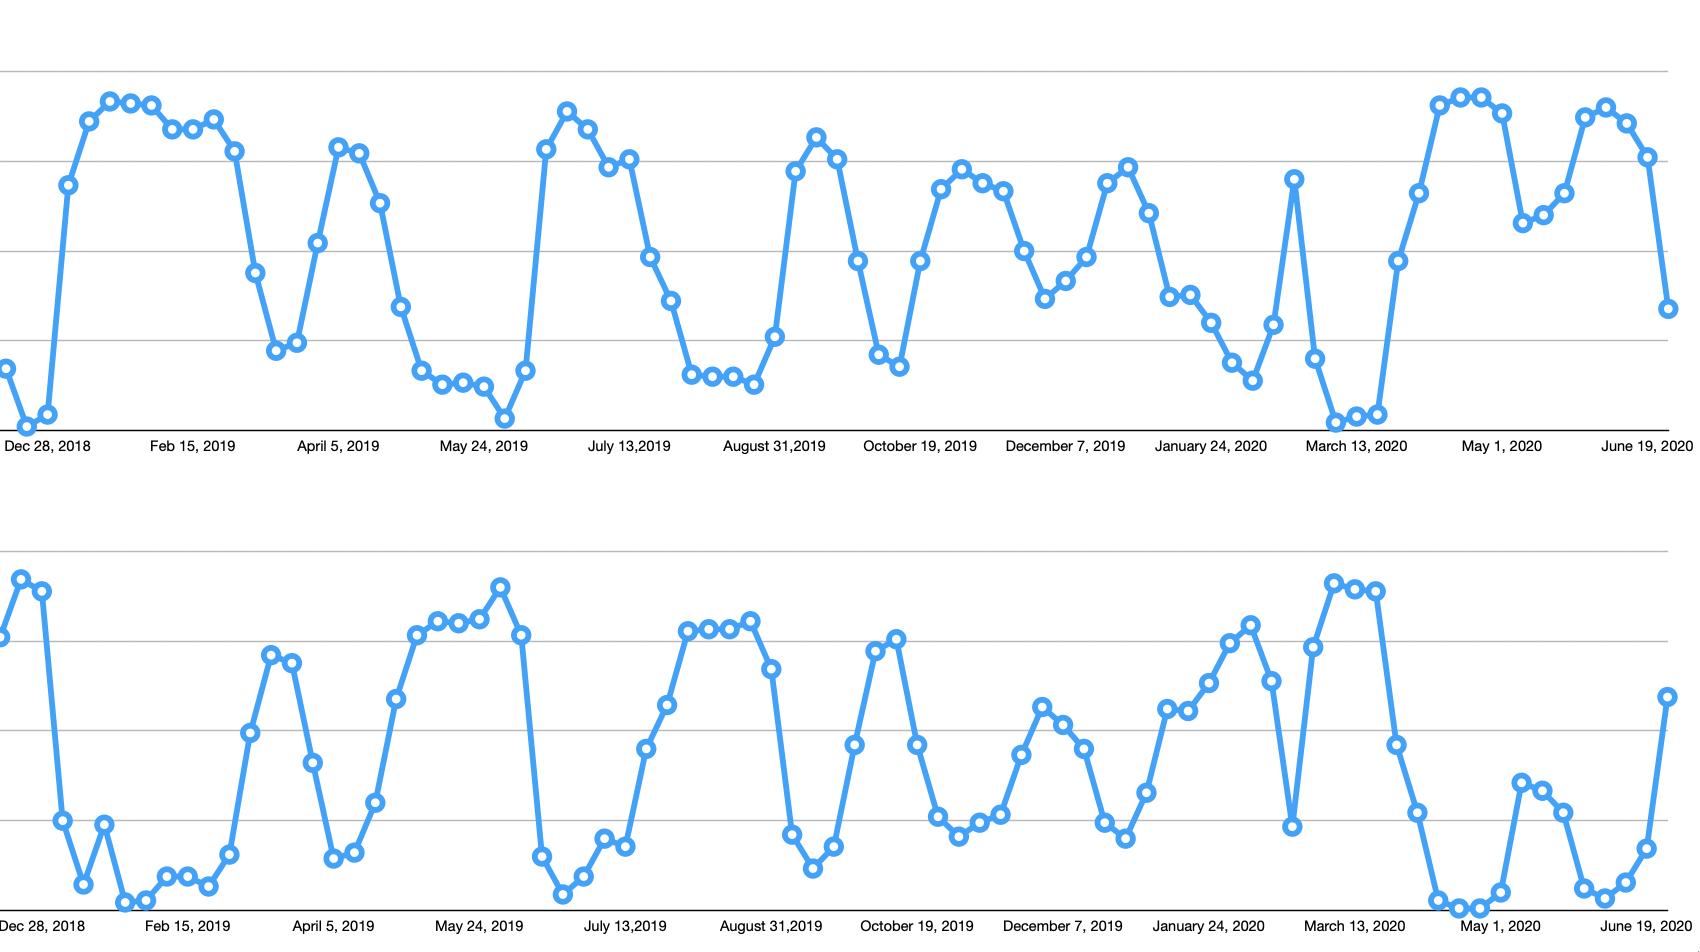
Some of my other analysis is marking some caution, as we start to see a bearish bias moving into the majority of industries for swing traders. The top panel shows industry groups in uptrends for short-term trading. The chart clearly shows the weakness, and the graph below shows the bearish momentum picking up. Again, this is for swing traders positioning.

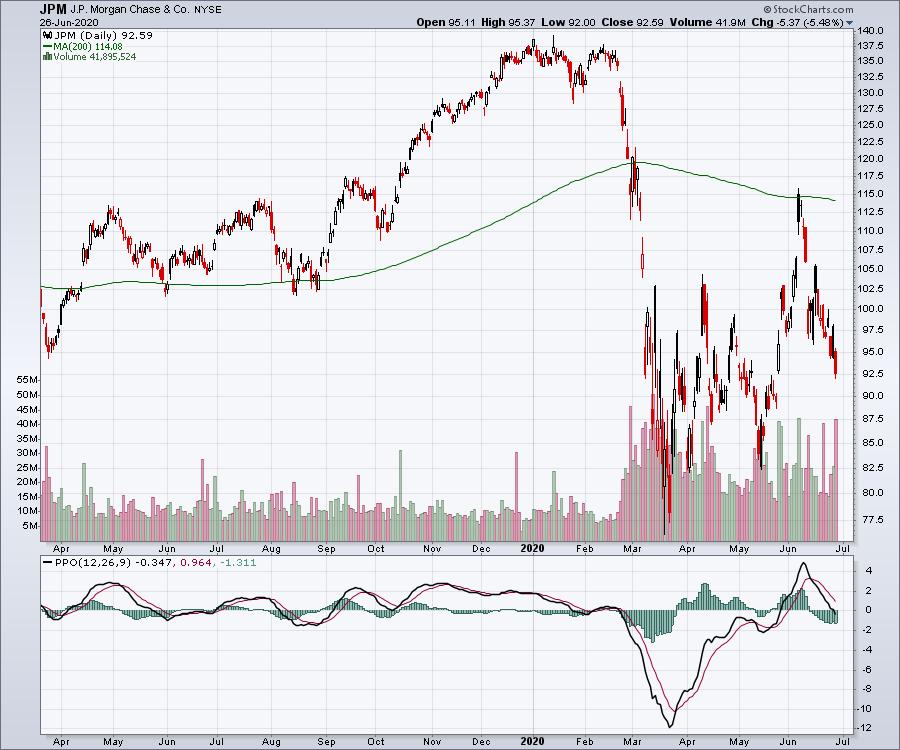
One of the industry groups that saw resistance at the 200-day moving average on the way up were the banks. Notice how JPM found support at the 200-DMA in 2019; it has now become resistance. The PPO is just moving below zero, so this is an important level for JPM to get some strength. Unfortunately, with the weak backdrop of the index shown above, it looks more likely that the banks are going to struggle here.

If you would like more information about some of my private indicators, you can check out a monthly subscription at GregSchnell.com for $79. As this market starts to grind, you might find some of the unique indicators more helpful.
Good trading,
Greg Schnell, CMT, MFTA
Senior Technical Analyst, StockCharts.com
Author, Stock Charts For Dummies
Want to stay on top of the market's latest intermarket signals?
– Follow @SchnellInvestor on Twitter
– Connect with Greg on LinkedIn
– Subscribe to The Canadian Technician
– Email at info@gregschnell.com
