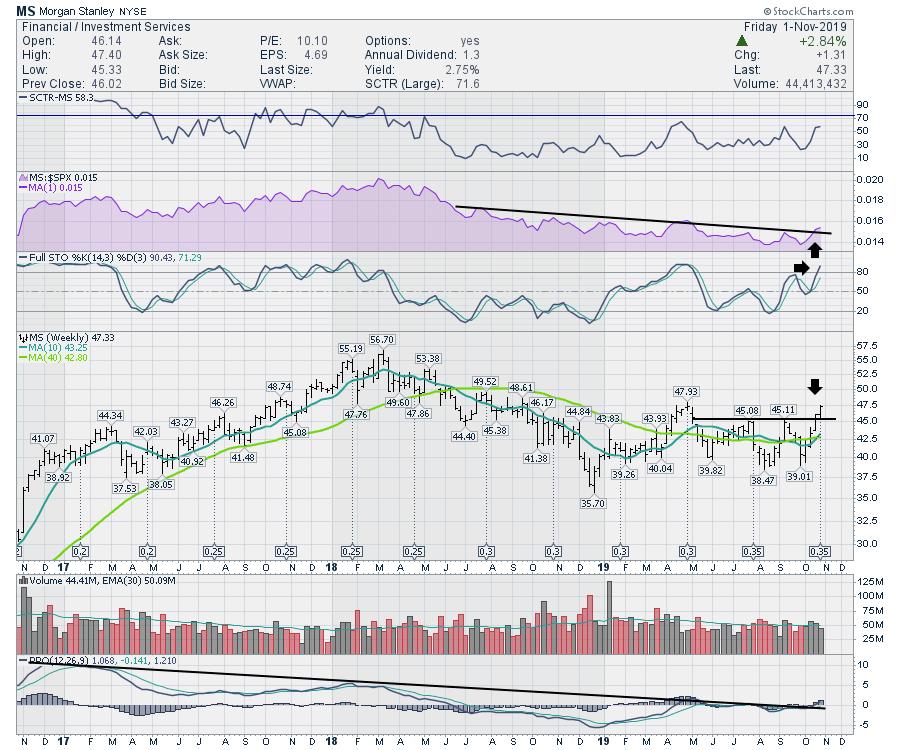
Investment Services are tucked within the Financial Sector and, on Friday, Morgan Stanley (MS) was the first past the post to make higher highs. The chart looks good. Probably one of the changes I like the most on it is the purple-shaded area where Morgan Stanley has broken the downtrend. On the PPO, notice how the trend lower in momentum is also breaking for the first time in years. I like that that they are both starting to break together.

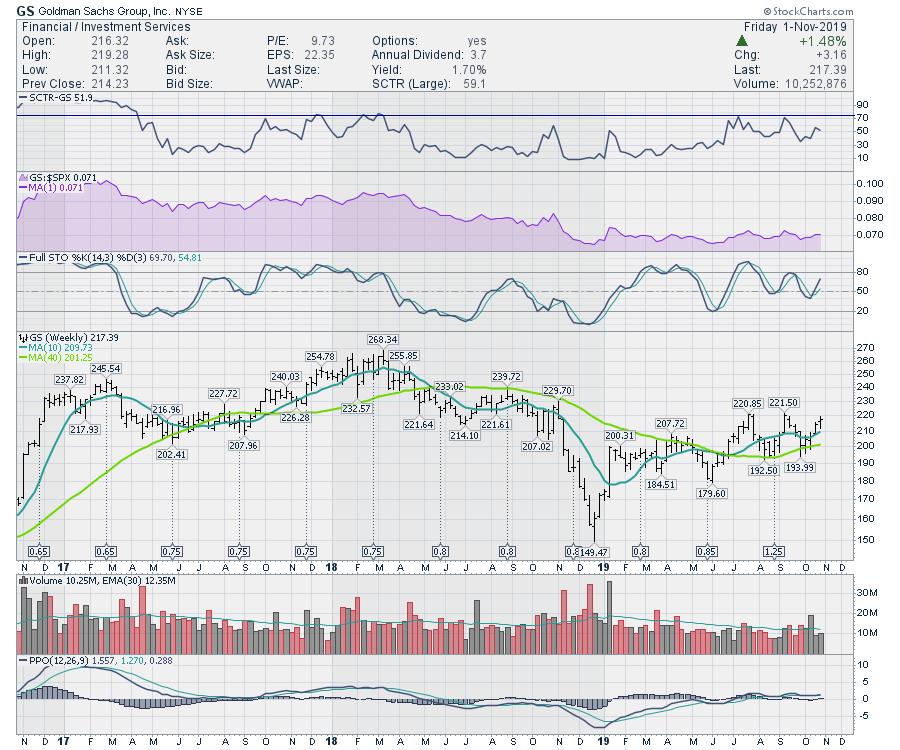
Another big player in the space is Goldman Sachs (GS). If Goldman can break above $222, that will be a new 52-week high. While the chart is not showing the same uplift in momentum, that is what I would be watching for on Goldman - or stay with the leader, MS.

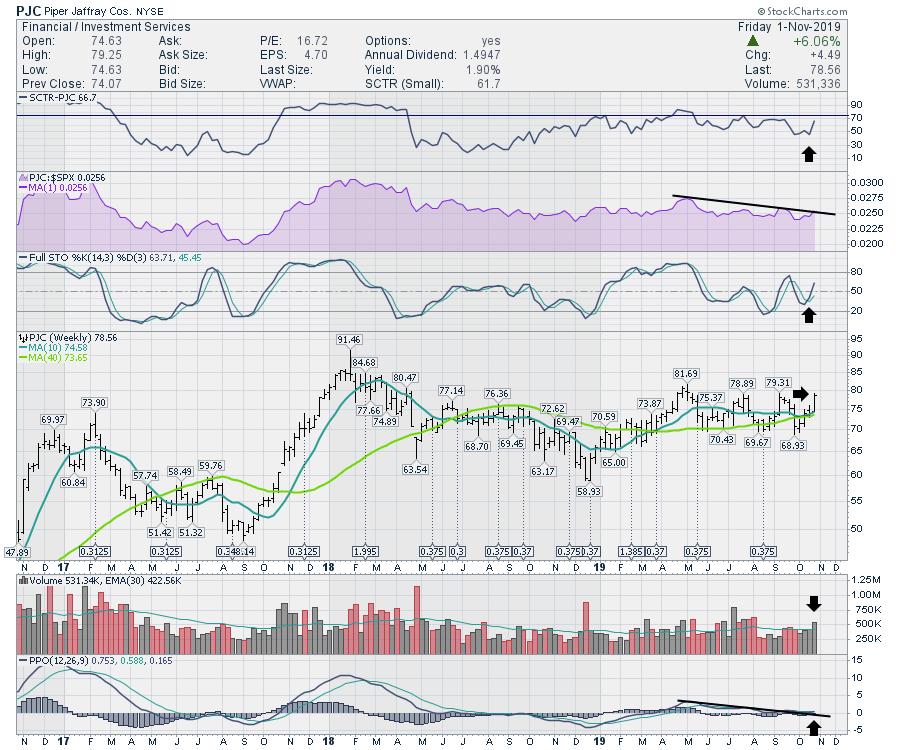
I like Piper Jaffray (PJC) as a company. The chart is a little behind Morgan Stanley, but very similar to Goldman Sachs. It wouldn't take much to get going as volume showed up this week, so someone is interested in buying the stock here. It needs to push through $82, but another week like this week and that's a done deal.

I like the space and these charts look set up to run into the fourth quarter here.
I did launch my new website this week; if you are interested in subscribing, you can find the options on the Private Investor tab at gregschnell.com.
Thanks for following my work!
Good trading,
Greg Schnell, CMT, MFTA
Senior Technical Analyst, StockCharts.com
Author, Stock Charts For Dummies
Want to stay on top of the market's latest intermarket signals?
– Follow @SchnellInvestor on Twitter
– Connect with Greg on LinkedIn
– Subscribe to The Canadian Technician
– Email at info@gregschnell.com
