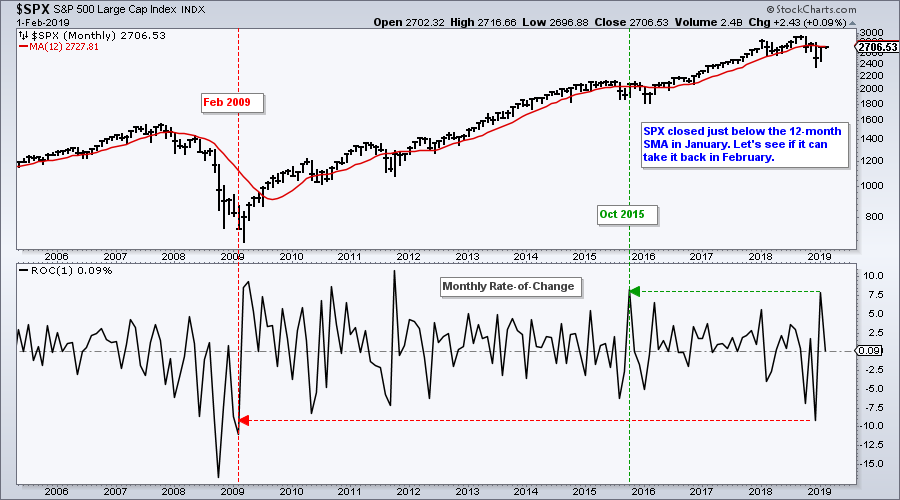
 One's outlook often depends on one's timeframe. This outlook can also be influenced by recent price action or a recency bias. The S&P 500 surged 7.87% in January and recorded its biggest monthly advance since October 2015. This surge, however, was preceded by a deeper 9.18% decline in December and the biggest monthly loss since February 2009. Taking the two months together, the bears still have the monthly scoring edge.
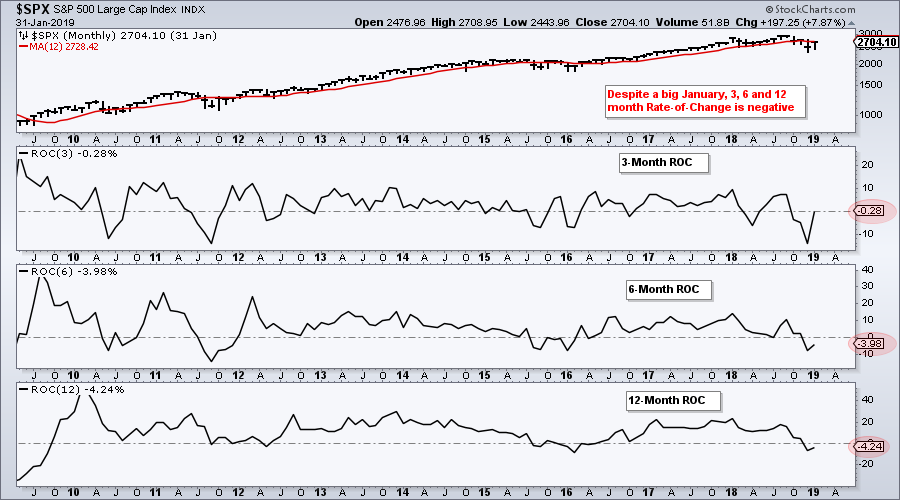
The January gain is clearly impressive by itself, but the picture dims when we step back three, six and twelve months. Based on the January close, the index is essentially flat over the last three months (-.28%), down 3.98% over the last six months and down 4.24% over the last twelve months. These are not the Rate-of-Change figures one would normally associate with a bull market.
Rate-of-Change is perhaps the purest momentum indicator of all. One month momentum looks great, but three, six and twelve month momentum do not. Admittedly, the declines over the last three to twelve months are not dramatic and perhaps not worthy of a bear market label. However, traders looking for momentum names and leaders would surely pass on the S&P 500 with these Rate-of-Change numbers.
On Trend on YouTube
Monitoring Precarious Cross Currents
- Pennant Breakouts and Sector Leaders
- FB and AAPL Lead as AMZN and TWTR Flag
- Several HACK Stocks Clear December Highs
- XLE Stalls ahead of Big Earnings from Key Stocks
- ITB and XHB Break out of Flags (plus stocks)
- Two Airline Stocks Take Off
- Click here to Watch
Monitoring Precarious Cross Currents
- Short-term Breadth Indicators Holding Up
- A Battle Royal Between Two SMAs
- Going Nowhere with 4 Gaps in 6 Days
- Key Supports for Sector and Industry ETFs
- Bonds, Dollar, Gold and Oil
- Click here to Watch
- Arthur Hill, CMT
Senior Technical Analyst, StockCharts.com
Book: Define the Trend and Trade the Trend
Twitter: Follow @ArthurHill


