With a wretched finish for the fourth quarter of 2018, I found many colleagues and friends weren't so much ringing in the new year as they were wringing it in. With almost every professionally-managed portfolio holding meaningful levels of the FAANG stocks, there was a dark shadow cast across the money managers for ignoring the risks of declining momentum. With major portfolio dips, everyone is wondering what to do next. The markets already went down 20% from the highs, so it could be expected that a rally will start the year. It is the question of how the year 2019 is going to finish that will really be hard for investors.
After a 20% drop, will we start a new long run rally that soars for a couple of years? Or do we have another leg down after a recovery rally? Do they ignore sell signals and just keep holding even after the first purge?
The emphasis for me is on the US Dollar in 2019. If the dollar drops, I would expect significant outperformance by the emerging markets and commodities. If the dollar rises, I would want to favor the US, but picking the winning sectors is more difficult. In a defensive environment, which is what I would expect if the dollar stays strong, we would want the staples and utilities. In a growth environment, which I don't expect but continue to watch for, we would want communications, technology, biotech and industrials.
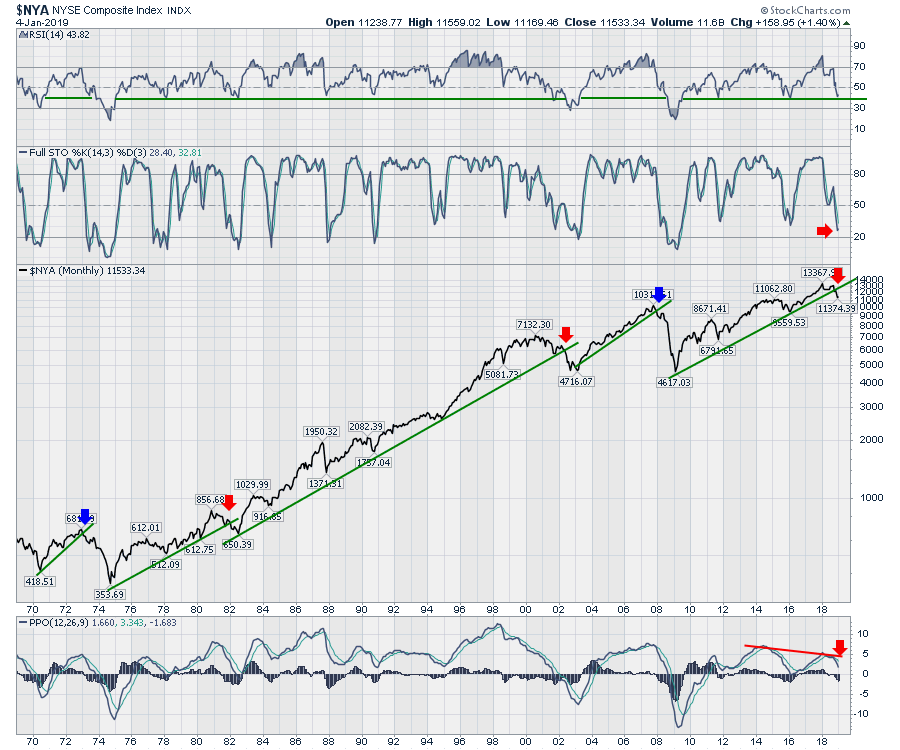
How many managers ignored the long term warning from the momentum indicators on the indexes? With hindsight being 20/20, we can gather a few things here. We sit on an interesting precipice. If we look at the RSI, this 40 level is where the markets have bounced from before, not to mention that this location was a fabulous place to get long. There have been 7 bounces from this level, including the 1988 and 1990 lows. It looks so easy in hindsight. There are some very meaningful wiggles near 40 on the RSI that would have been very hard to trade. The chart also shows 4 breakdowns on the RSI below 40 on this monthly chart. Those were very severe bear markets, with deep dives much larger than 20%. The problem comes in the 4 RSI readings below 40.
When we look at the price action of those deep-diving RSI readings, two of them moved below the trend line, then reaccelerated. I have marked those with a red arrow. Unfortunately, the two others, marked with blue arrows, took at least a year to resolve the final low. It does worry me a bit that we have already moved below the trend line meaningfully.
The one graphic illustration that is important on the Full Stochastic is that, once a bull market resumes, the up moves are big. This encourages everyone to try and buy the major dip. Notice how the trend is almost straight up on the Full Stochastic after the lows came in.
 Lastly, the PPO indicator is on the bottom. This indicator has only gone below 0 on the monthly charts four times in the last fifty years. Any bounce off the zero line suggests you want to be long and strong, but even waiting for the monthly PPO to turn at zero can leave a huge percentage gain out of the portfolio.
For me, the answer is to buy on this big pullback and maintain stops. Hopefully, you have already put some money to work and caught a big move on Friday. As we approach the previous levels of support, which will be resistance, the market will need to find a fresh reason to surge through resistance. Perhaps that is the January-February 2019 earnings season.
The difficult part comes after the bounce-back rally. Do we have enough power to break the downward-trending momentum and reaccelerate to the upside? If we don't, we will probably revisit the December lows.
So, we'll continue to ride the uptrend. Keep moving up stops to make sure the gains are captured. Better to get kicked out with a gain than to wish we had not ignored the long term signals. If we are not entering a longer-term bear market, the breadth indicators, like net new highs, will start to improve. If they can't get going, you sold before the markets got really ugly.
Lots more on this weekend's market wrap.
On The Final Bar, I reviewed Apple, Oil and Gold.
If you would like to learn more about the basics of charting, check out Stock Charts for Dummies. The first section of the book walks through all the chart settings to get the charts you want, the second section explores why you might use charts for investing and the third section is about putting it all together.
Click here to buy your copy of Stock Charts For Dummies today!
If you are missing intermarket signals in the market, follow me on Twitter and check out my Vimeo Channel. Bookmark it for easy access!
Good trading,
Greg Schnell, CMT, MFTA
Senior Technical Analyst, StockCharts.com
Author, Stock Charts for Dummies
Hey, have you followed Greg on Twitter? Click the bird in the box below!
Want to read more from Greg? Be sure to follow his StockCharts blog:
The Canadian Technician
