It was a brutal week for many areas of the stock market, but mostly those areas that have led the charge for so long. Stocks that for one to two years or more rarely saw a significant pullback suddenly couldn't find buyers this week. Unfortunately, that's how Wall Street works. Ever notice how quickly the market sells and how long it takes to recover. The January-February episode was a perfect example. The Dow Jones lost more than 3000 points in 10 trading days! Then the recovery back to the January high took more than 7 months. The answer would be to simply get out of the market before the panicked plunges, but these short-term selling episodes are very difficult to predict and then time correctly. Who saw last week's plunge coming? Seriously. Usually, summer time represents a period of selling, but Q3 turned out to be our best quarter in a few years. Given that backdrop, it was difficult to be overly bearish heading into Q4, yet our first week was awful.
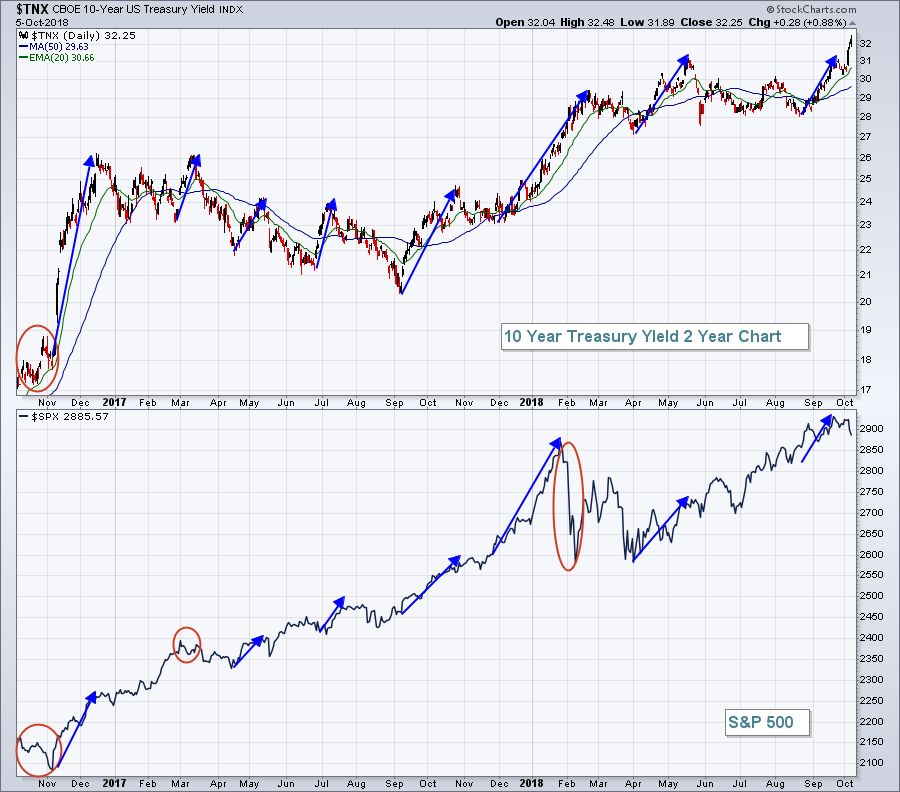
So the big question now is.......do we bottom this week and begin to repair the technical damage? I think we will. The stock market was spooked by the prospects of higher interest rates as the 10 year treasury yield ($TNX) surged through yield resistance at 3.11% to close the week at 3.23%, our highest weekly close since 2011. Yes, interest rates are going higher, but they're not a problem.....yet. In fact, recent surges in the TNX have been accompanied by rising equity prices and, in the end, I suspect that will be the case this time as well. Here is a visual of TNX surges and accompanying rises in the S&P 500:
 This illustrates that when money is rotating away from defensive treasuries (and corresponding treasuries yields rise), it's typical for that money to find its way into U.S. equities. The red ellipses above show that it's not always the case, but the overall trend in both the TNX and SPX are higher. Clearly, however, U.S. equities were spooked last week by the prospects of higher treasury yields. I believe this will turn out to be a short-term buying opportunity, much like the S&P 500 drops that we saw in October 2016, March 2017 and February 2018.
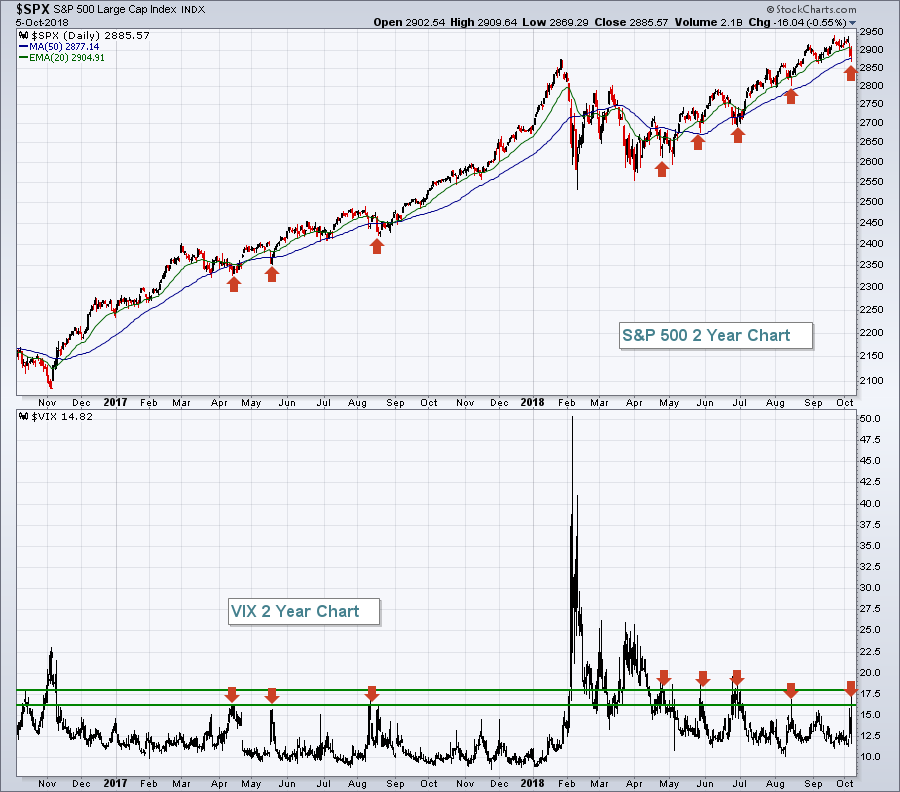
High volatility ($VIX) marks significant stock market bottoms. Check this out:
 Spikes in the VIX into the 16-18 area have coincided with many of the short-term bottoms in the S&P 500 over the past two years. On Friday, the VIX hit a high of 17.36. If we open up this week with further downside action, watch for a reversal in the VIX to potentially mark the short-term bottom.
Happy trading!
Tom
