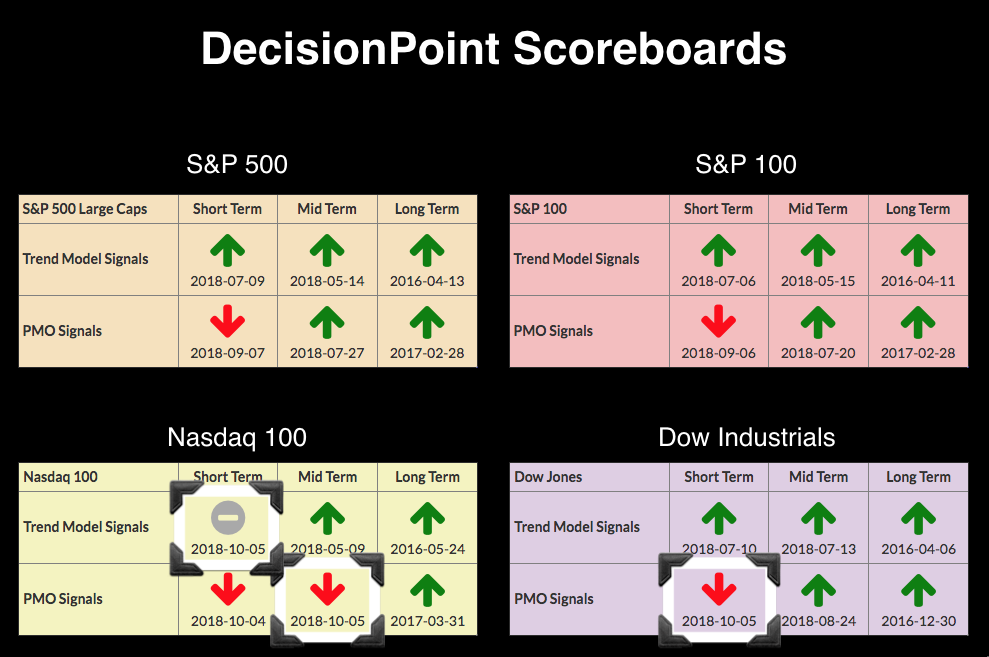
The BUY signals are starting to peel away on the DecisionPoint Scoreboards. The Dow which has been the most stout, but after the corrective move of the past two days, it couldn't hang on to its "all green" Scoreboard. Technology, as most know, has been hit particularly hard over the past month or more, so I'm not surprised to see the NDX Scoreboard flipping quickly to bearish signals.

Here's where these signal changes come from.
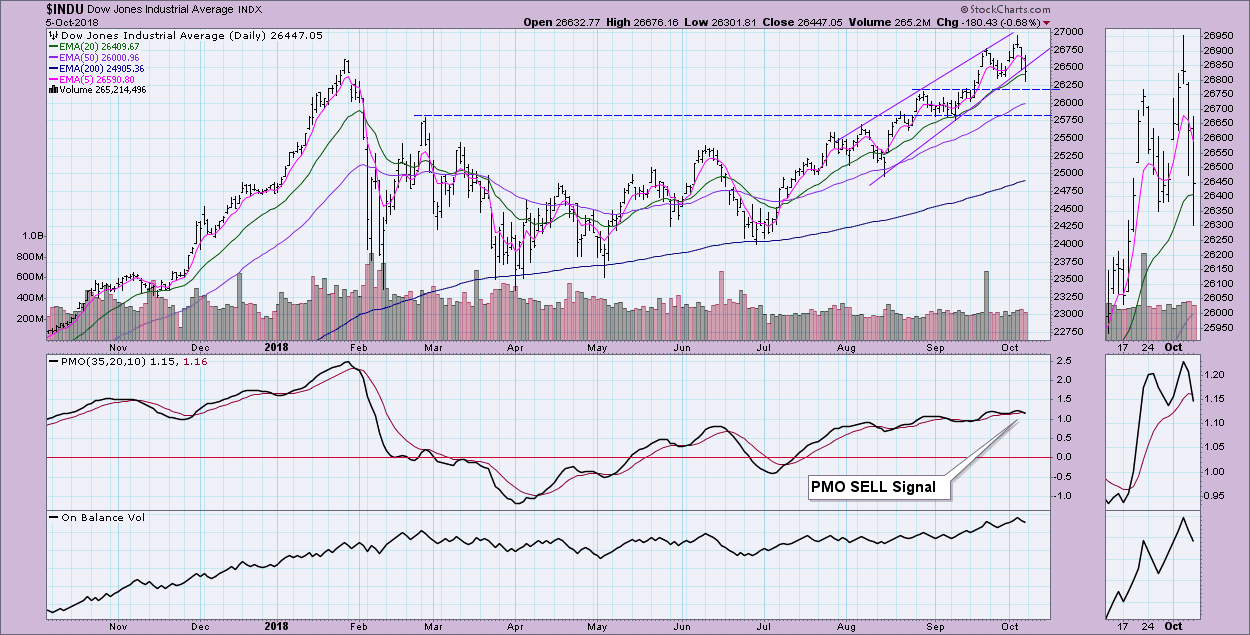
The Dow saw its Price Momentum Oscillator (PMO) negative crossover its signal line to generate the SELL signal. Today we saw the breakdown of a rising wedge. If you do a measurement of the base of the wedge and add that downside distance to the breakdown point, you end up at support along the February top.
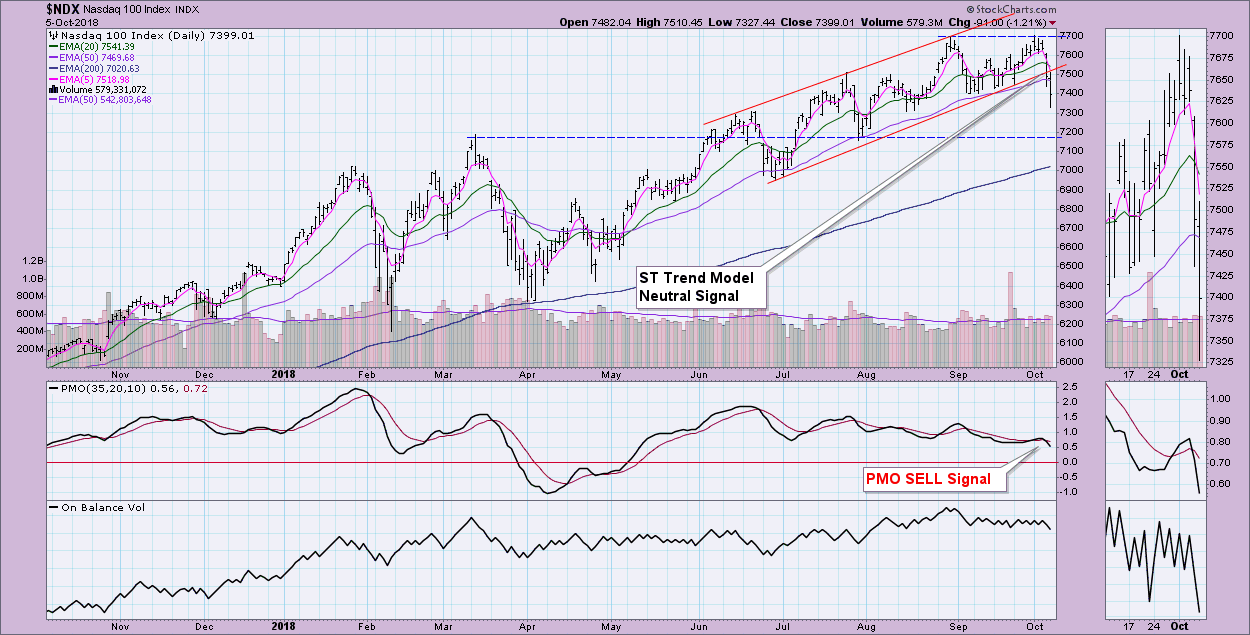
The Short-Term Trend Model Neutral signal on the NDX was generated when the 5-EMA crossed below the 20-EMA. It is a Neutral signal because the negative crossover occurred above the 50-EMA. The PMO crossed below its signal line yesterday for the short-term PMO SELL signal. With the bearish features of this chart, I would look for a test of support at 7200.
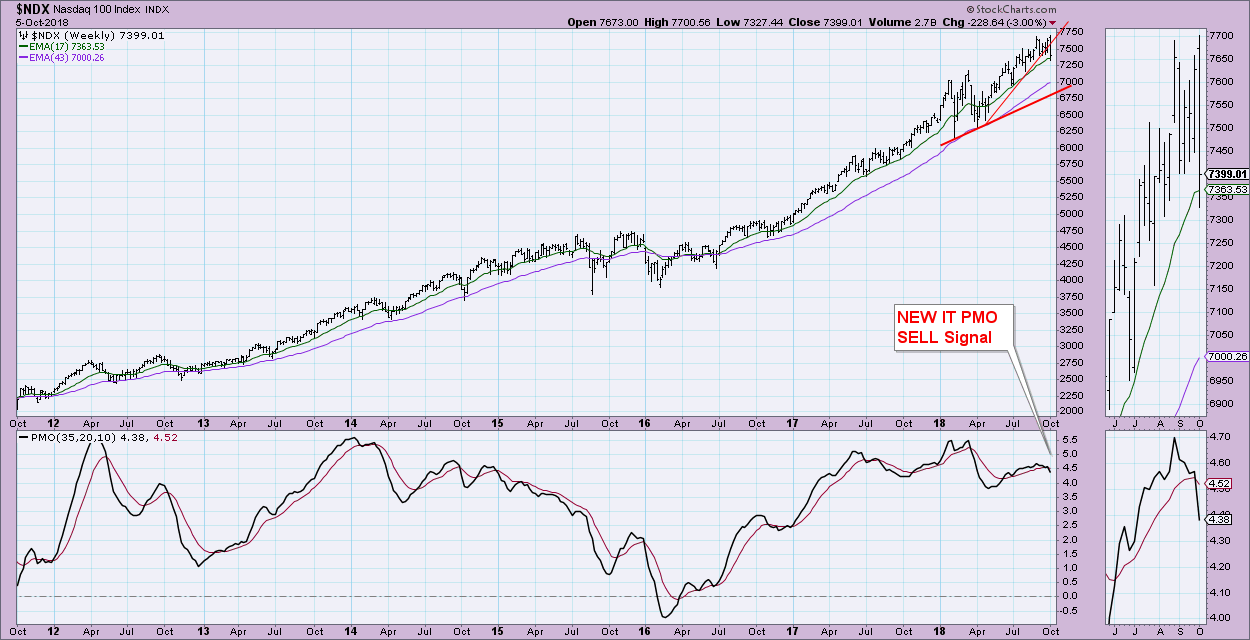
This IT PMO SELL signal is the most concerning for me. We don't get frequent signal changes on our weekly and monthly charts, so when I see them, I heed them. The NDX is the weakest of the four Scoreboard indexes. I think this SELL signal confirms not only the PMO SELL signal on the daily chart, but it also confirms the bearishness of this latest breakdown from a rising trend.
Technical Analysis is a windsock, not a crystal ball.
Happy Charting!
- Erin
Helpful DecisionPoint Links:
DecisionPoint Shared ChartList and DecisionPoint Chart Gallery
Price Momentum Oscillator (PMO)
Swenlin Trading Oscillators (STO-B and STO-V)
**Don't miss DecisionPoint Commentary! Add your email below to be notified of new updates"**


