ChartWatchers September 28, 2018 at 06:53 PM

Okay, I’ll admit, this was just about the worst-kept secret of the year. That said, it doesn’t detract from the good news. Last week, we launched an expanded partnership with David Keller and officially introduced his new blog, The Mindful Investor... Read More
ChartWatchers September 28, 2018 at 02:51 PM
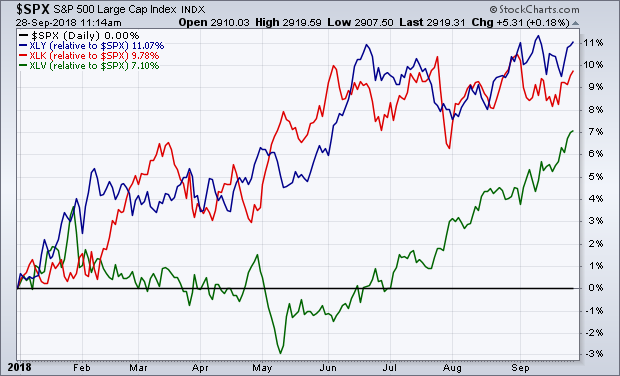
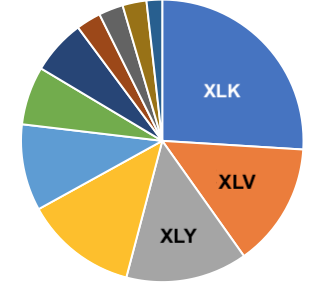
Editor's Note: This article was originally published in John Murphy's Market Message on Friday, September 28th at 12:29pm ET. The three strongest sector leaders since the start of this year have been consumer cyclicals, technology, and healthcare (in that order)... Read More
ChartWatchers September 15, 2018 at 11:15 AM

With another SpaceX launch and more news this week about delivering multiple cargos on one delivery rocket, the Aerospace industry continues to accelerate. This week, the group of public aerospace companies all sported nice chart setups heading into the fourth quarter... Read More
ChartWatchers September 15, 2018 at 08:55 AM
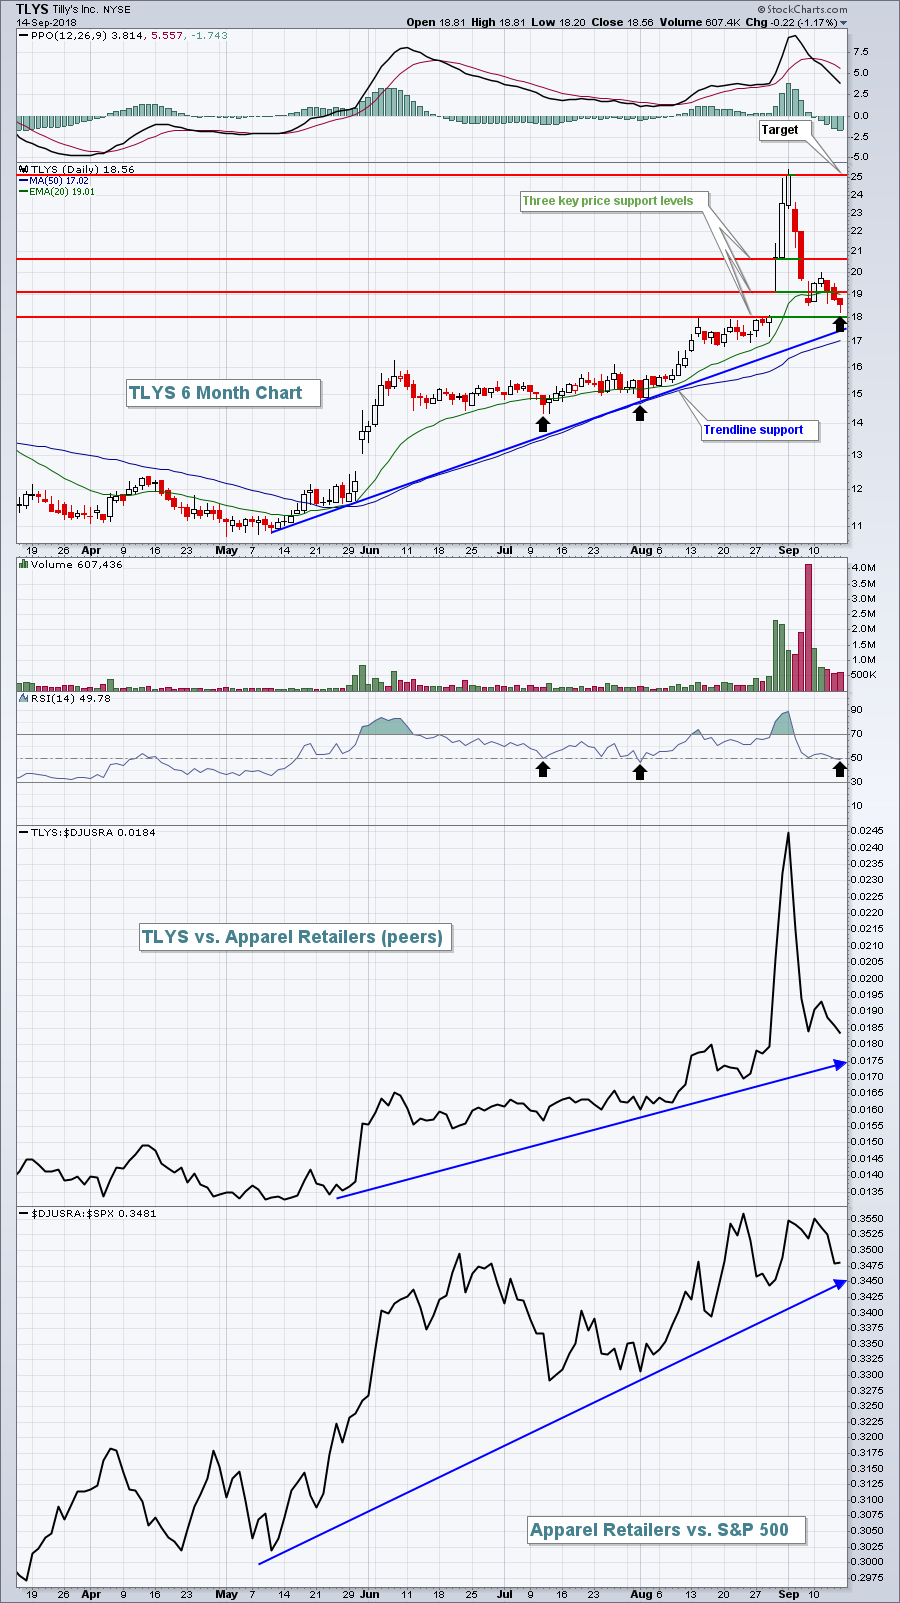
Special Offer If you would like a copy of my Strong Earnings ChartList, simply follow these steps and I'll send it to you: 1. You MUST be a paid Extra or Pro member of StockCharts.com as that's the only way you can download my ChartList... Read More
ChartWatchers September 15, 2018 at 08:30 AM
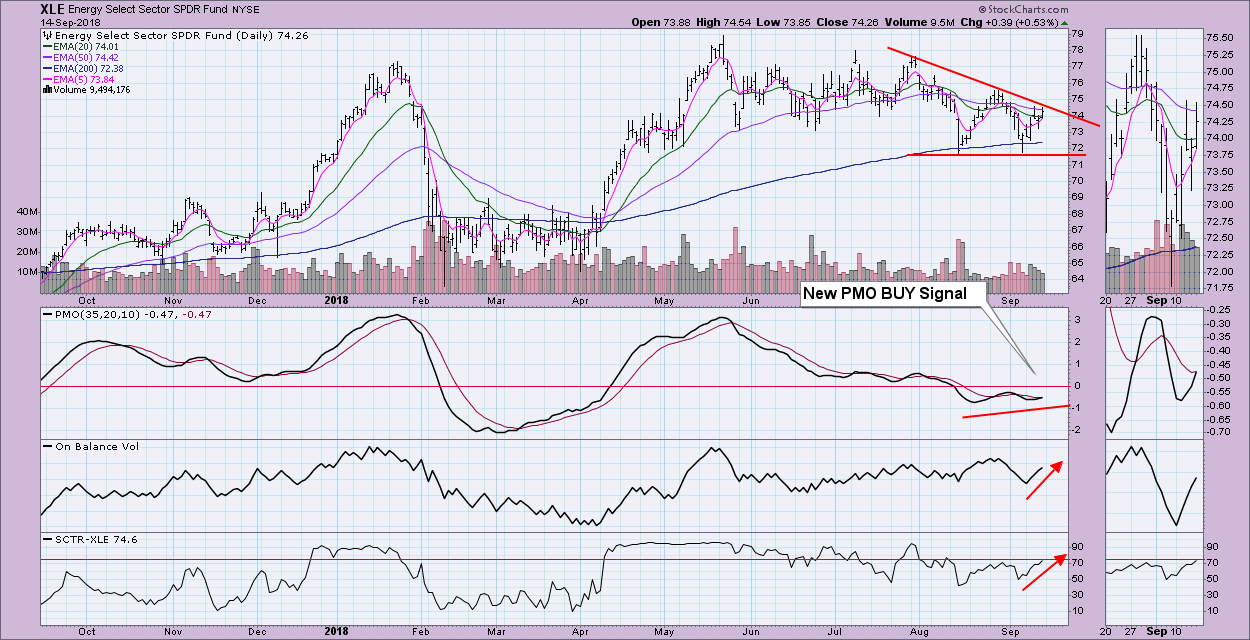
If you look at our DecisionPoint Sector Scoreboard below you'll see that the Energy is the only sector carrying an Intermediate-Term Trend Model Neutral signal. All other sectors have BUY signals in both the intermediate term and long term... Read More
ChartWatchers September 15, 2018 at 08:00 AM
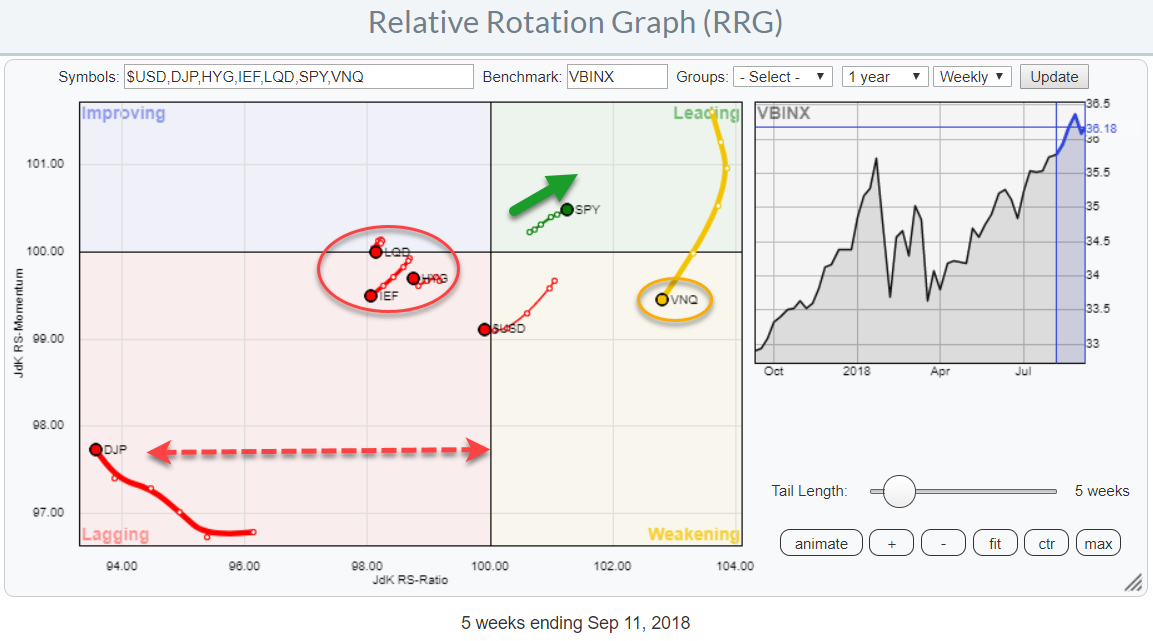
The Relative Rotation Graph shows the relative positions of various asset classes (ETFs) against VBINX, a Vanguard balanced index fund, as the benchmark... Read More
ChartWatchers September 15, 2018 at 04:52 AM

There are lots of indicators out there, but one metric stands head and shoulders above the rest. No, it is not a head-and-shoulders pattern. There are hundreds, if not zillions, of ways to measure the trend and identify trend reversals... Read More
ChartWatchers September 14, 2018 at 11:35 PM
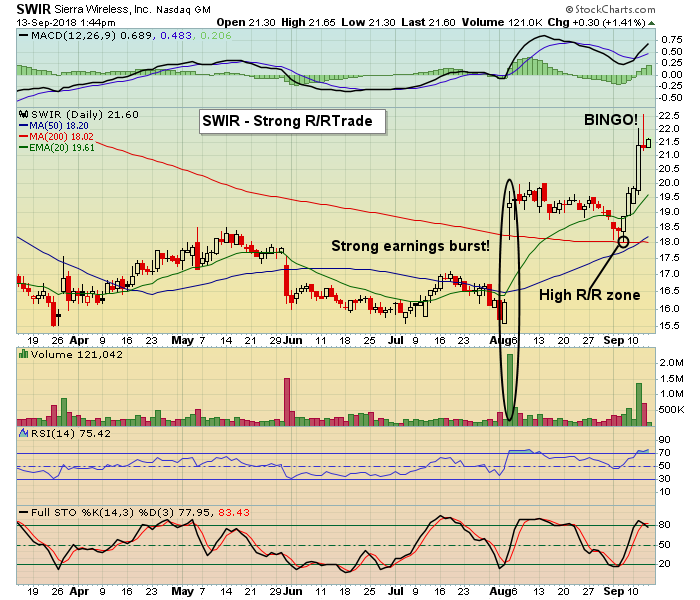
The bulls have remained in charge for a long time now in large part due to continuing, strong earnings. Even with the constant daily noise surrounding the market it almost always comes down to the bottom line... Read More
ChartWatchers September 01, 2018 at 12:35 PM
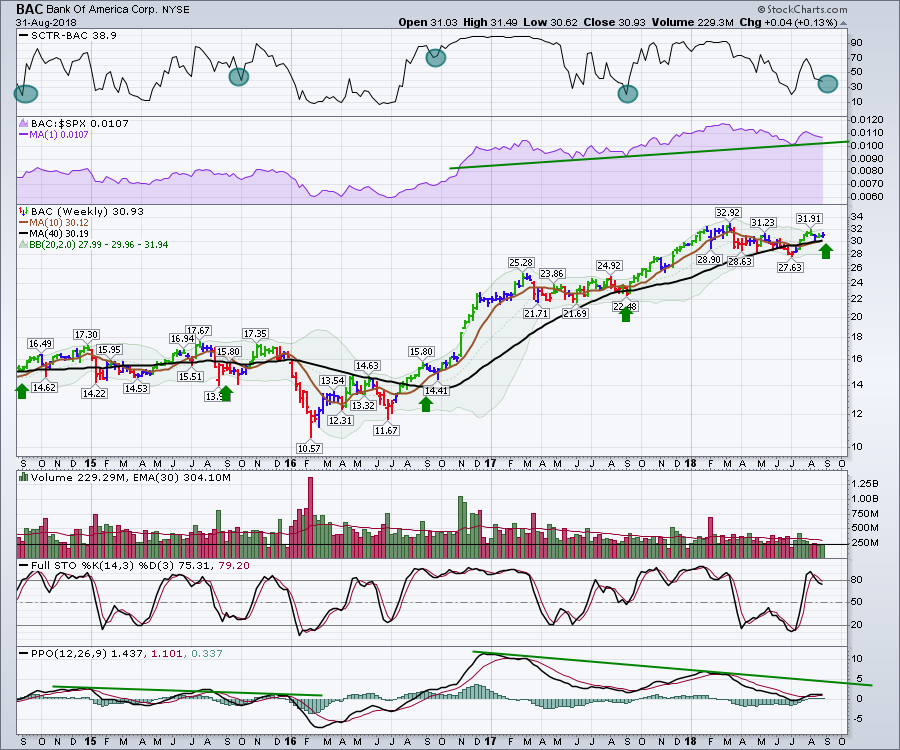
At one of the CMT Association meetings in NYC, I was given an interesting tip about the markets. The tip was that bank charts hold clues because bankers see everyone else's business success from the financial side... Read More
ChartWatchers September 01, 2018 at 08:00 AM
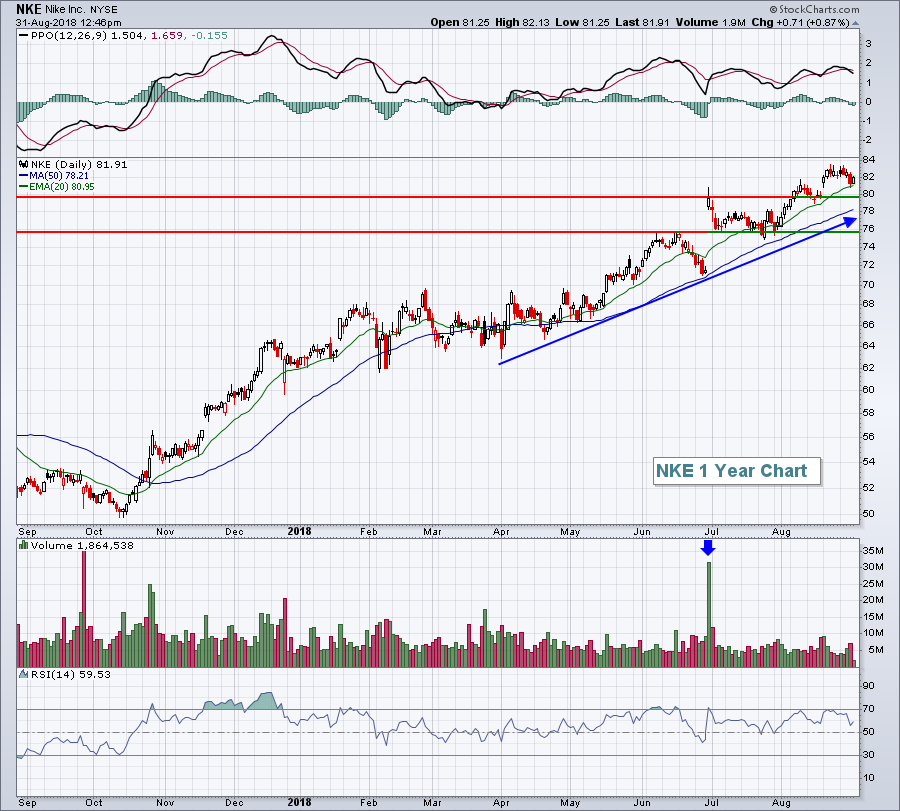
It's widely known that September historically has been a difficult month for U.S. equities. Since 1950, the S&P 500 has risen during the month of September 30 times and moved lower 38 times. It's the only calendar month where the bears have had long-term success... Read More
ChartWatchers September 01, 2018 at 06:44 AM
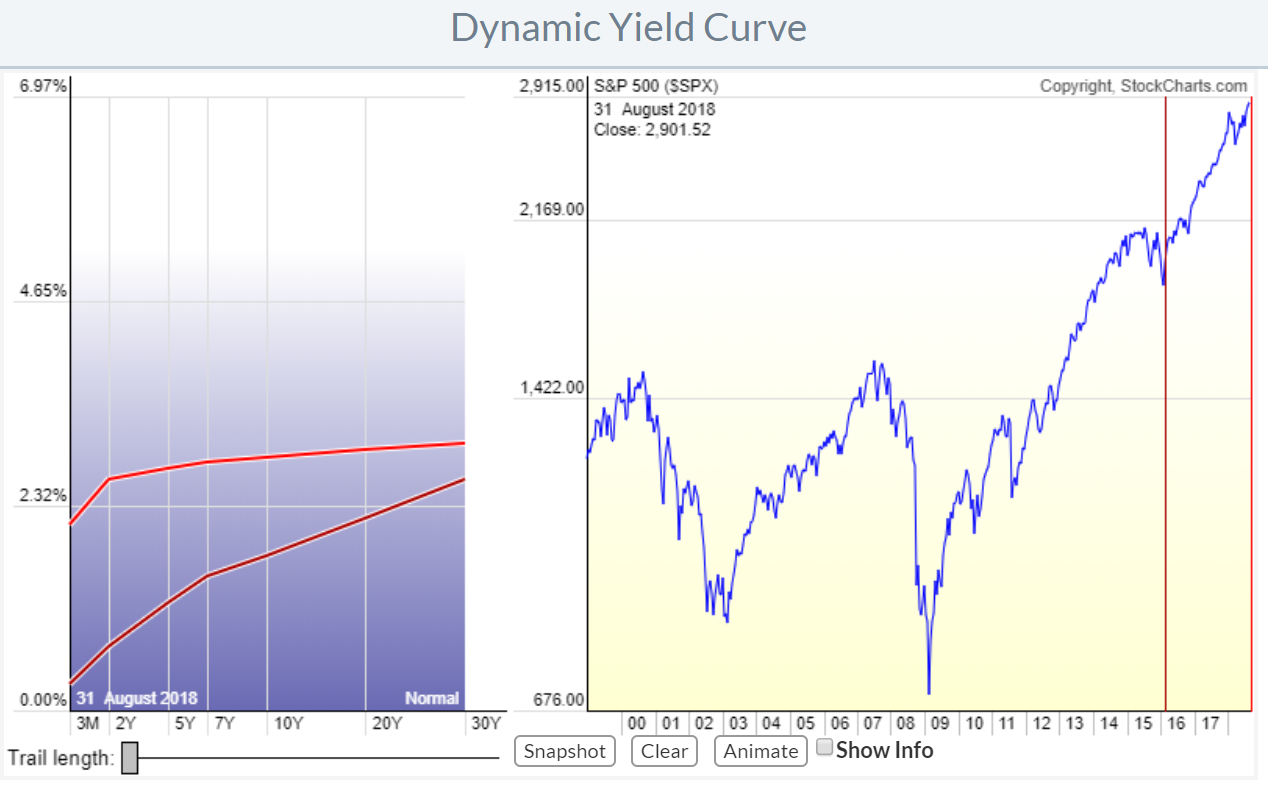
In one of my recent articles, I high lighted that Relative Rotation Graphs can do (much) more than just show equity sector rotation by showing how RRG can be used to analyze rotation among the different commodity groups against a broad commodity index... Read More
ChartWatchers September 01, 2018 at 03:49 AM
The S&P 500 hit a new high in August, but only four of the ten sector SPDRs joined in on this high: the Consumer Discretionary SPDR, the Technology SPDR, the Health Care SPDR and the Real Estate SPDR. This suggests that the other six are lagging in some way shape or more... Read More