Special Offer
If you would like a copy of my Strong Earnings ChartList, simply follow these steps and I'll send it to you:
1. You MUST be a paid Extra or Pro member of StockCharts.com as that's the only way you can download my ChartList. If you're unsure of your account service level, click on the "Your Account" tab in the upper right hand corner when you're on the SC.com home page. At the very top of the Your Account page under Membership Details, you'll find your service level. That must say either Extra or Pro. If it says Basic, you will need to upgrade your membership before being able to download a ChartList from another subscriber. If you're not a current paid member, I have to ask you why. Seriously! There are so many tools and features here at StockCharts.com to help you outperform the stock market...and at a minimal cost. Invest in your future and subscribe today to begin your FREE 30 day trial. Just do it! And make sure you start out as an Extra or Pro member so you can download my Strong Earnings ChartList. :-)
2. You must provide me the email address that is linked to your StockCharts.com account. Again, under "Your Account", make sure that you provide me the email address that matches your "User ID" next to "Account Info".
3. Send me an email (tomb@stockcharts.com) requesting my Strong Earnings ChartList. Simply type in "Strong Earnings" in the subject line of your email. I expect I'll have a lot of requests, but I'll try to respond to everyone within 24-48 hours.
4. In exchange for allowing me to send you my ChartList, EarningsBeats.com (my former company) will be provided your email address for a free daily newsletter. There'll be no charge for the newsletter and you can cancel at any time. EarningsBeats.com will not provide your email to any 3rd party, but may use it for their own promotional offers.
On Tuesday, September 11th, I explained the concept of my Strong Earnings ChartList, how I use it to trade, and the exact steps you'll need to follow to download this ChartList into your account (it's easy) - on Market Watchers LIVE. You can LISTEN HERE to a recording of that show. The Strong Earnings ChartList segment began just after the 20 minute mark and lasted roughly 30 minutes.
I believe firmly that this Strong Earnings ChartList will add much to your future trading success, so I hope you'll accept this one time offer. It's one way of thanking you for your loyalty and support these past few years. :-)
From this Strong Earnings ChartList, here are 3 of my favorite stocks (but there are over 300 stocks on this ChartList):
1. Tilly's, Inc. (TLYS)
I tend to favor companies that not only beat Wall Street's consensus estimates as to both revenues and earnings per share (EPS), but also skyrocket on massive volume after the quarterly results are posted. The first thing this signals to me is that Wall Street is trying to quickly revalue the company (much higher) based on the surprisingly excellent results. Who wouldn't want to own companies like that? My problem, however, is that I don't want to chase these companies and buy when everyone is euphoric. So they're strategically placed on my Strong Earnings ChartList and I wait. And I wait. And then I wait some more. I wait until the stock price pulls back to an area where I can justify a solid reward to risk trade. This waiting period might last 1-2 days or 1-2 months. Sometimes, there might not ever be a pullback. If that's the case, I simply congratulate those who chased and move on. I won't accept that kind of risk.
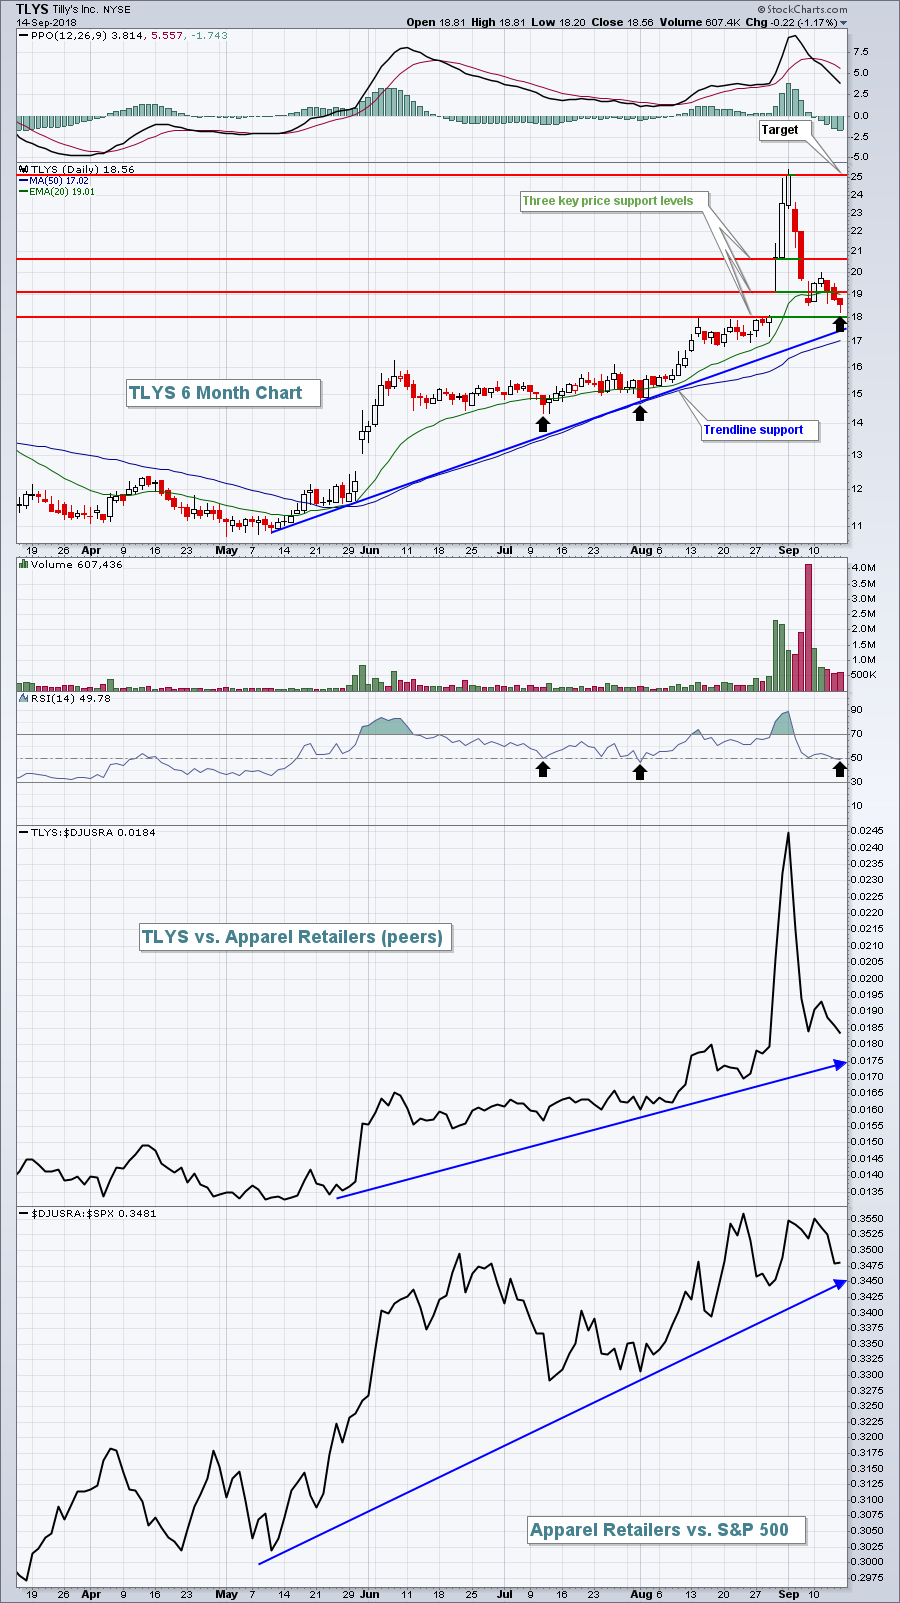
TLYS is a poster child for what I look for. On August 29th, TLYS reported its quarterly results. They beat revenue estimates, $157.4 million vs. $154.7 million, and beat EPS estimates, $.33 vs. $.29. The stock price reacted by jumping more than 40% the next three trading days on very heavy volume. Since that time, TLYS has fallen back into its gap support zone. Naysayers may point to the high volume that's accompanied the selling, but panicked selling occurs when you irresponsibly buy after a stock jumps 40%, only to watch it fall 20% in two days. Think about your emotions after a stock falls 20% that quickly. You trade emotionally and you sell. There were plenty of those folks last week. Volume is now settling down and TLYS is almost back to where it was when all the great quarterly earnings news was announced. I'll take the chance buying now. Here's the chart:
 TLYS is an apparel retailer, which has been a very strong industry group in 2018, especially since May. TLYS has also outperformed its peers, so you have a strong stock within a strong group, pulling back to key areas of support with a price target (25.00) well above current price. While that does not provide guarantee of a profitable trade, I certainly like the reward to risk characteristics here.
(Disclosure: I own shares of TYLS)
2. Yelp, Inc. (YELP)
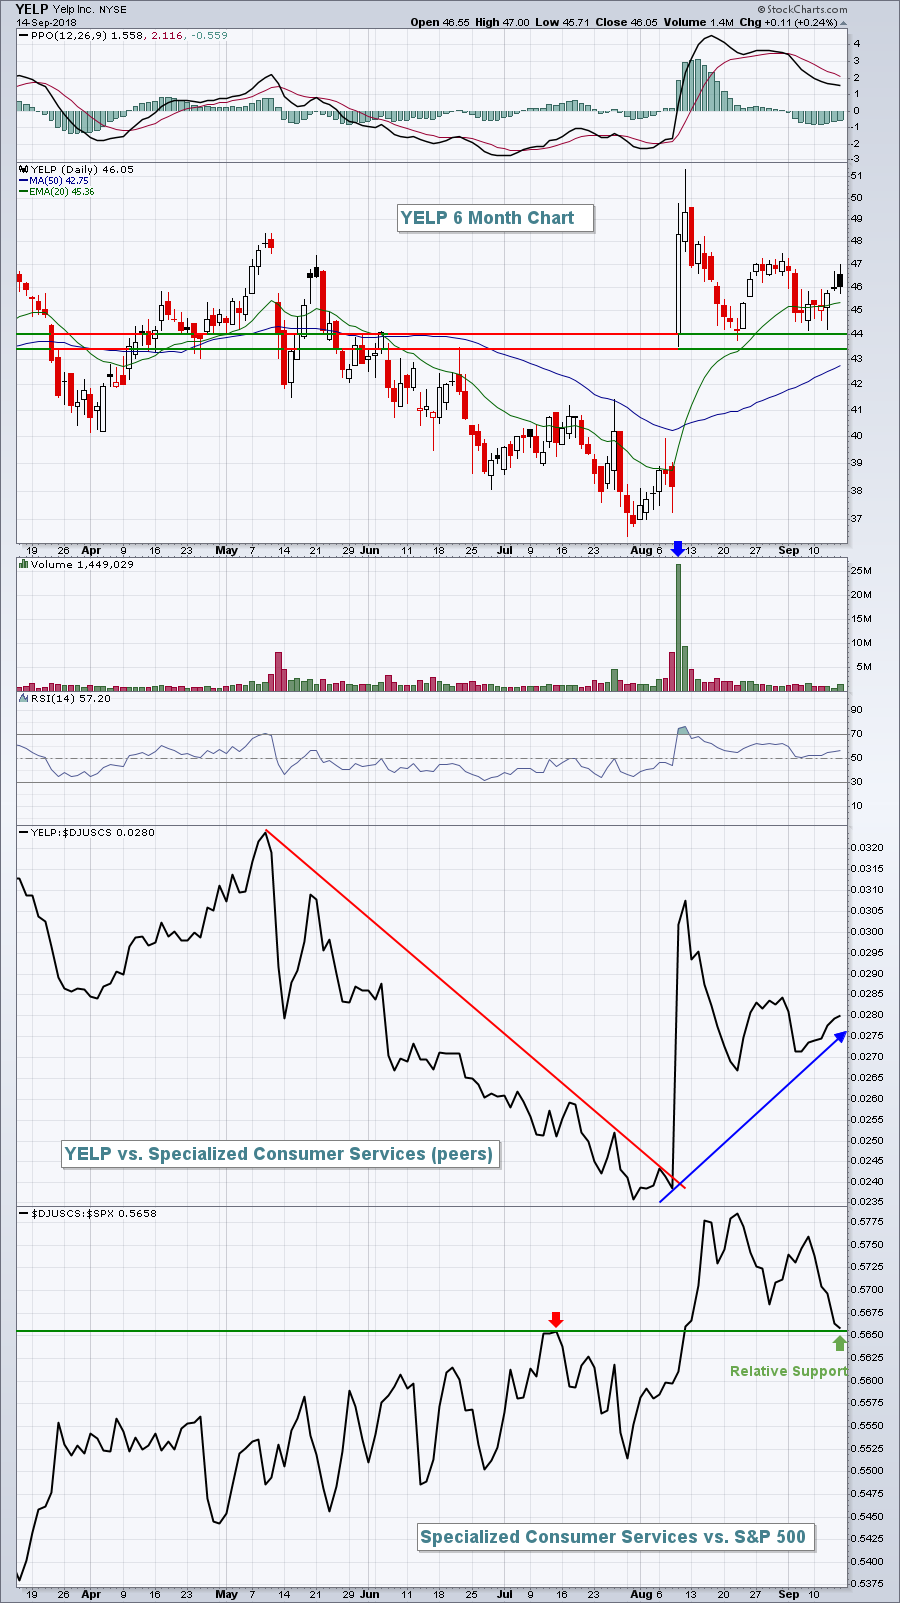
On August 8th, YELP blew away its consensus estimates. Revenue came in at $234.9 million vs. $232.3 million and EPS was $.38 vs $.25. Not even close. The reaction? How about a 34% move higher in two days? Chasing and buying at the top (51.00), however, would have resulted in more than a 14% loss over the next eight trading days when YELP returned to the top of its gap support:
 In this case, YELP failed to fill both the top and bottom of gap support. A move back to 38+ would be required to completely fill this gap. Good luck with that, I don't see it happening. There were so many buyers in the 43.50-44.00 area that I'd be surprised to see ANY close beneath 43.50. Again, no guarantee but the reward to risk from 44.00 would be very solid. Unfortunately, I missed this one on its recent trips to the 44 area, but I'm still watching it closely for perhaps one more visit.
3. Sierra Wireless, Inc. (SWIR)
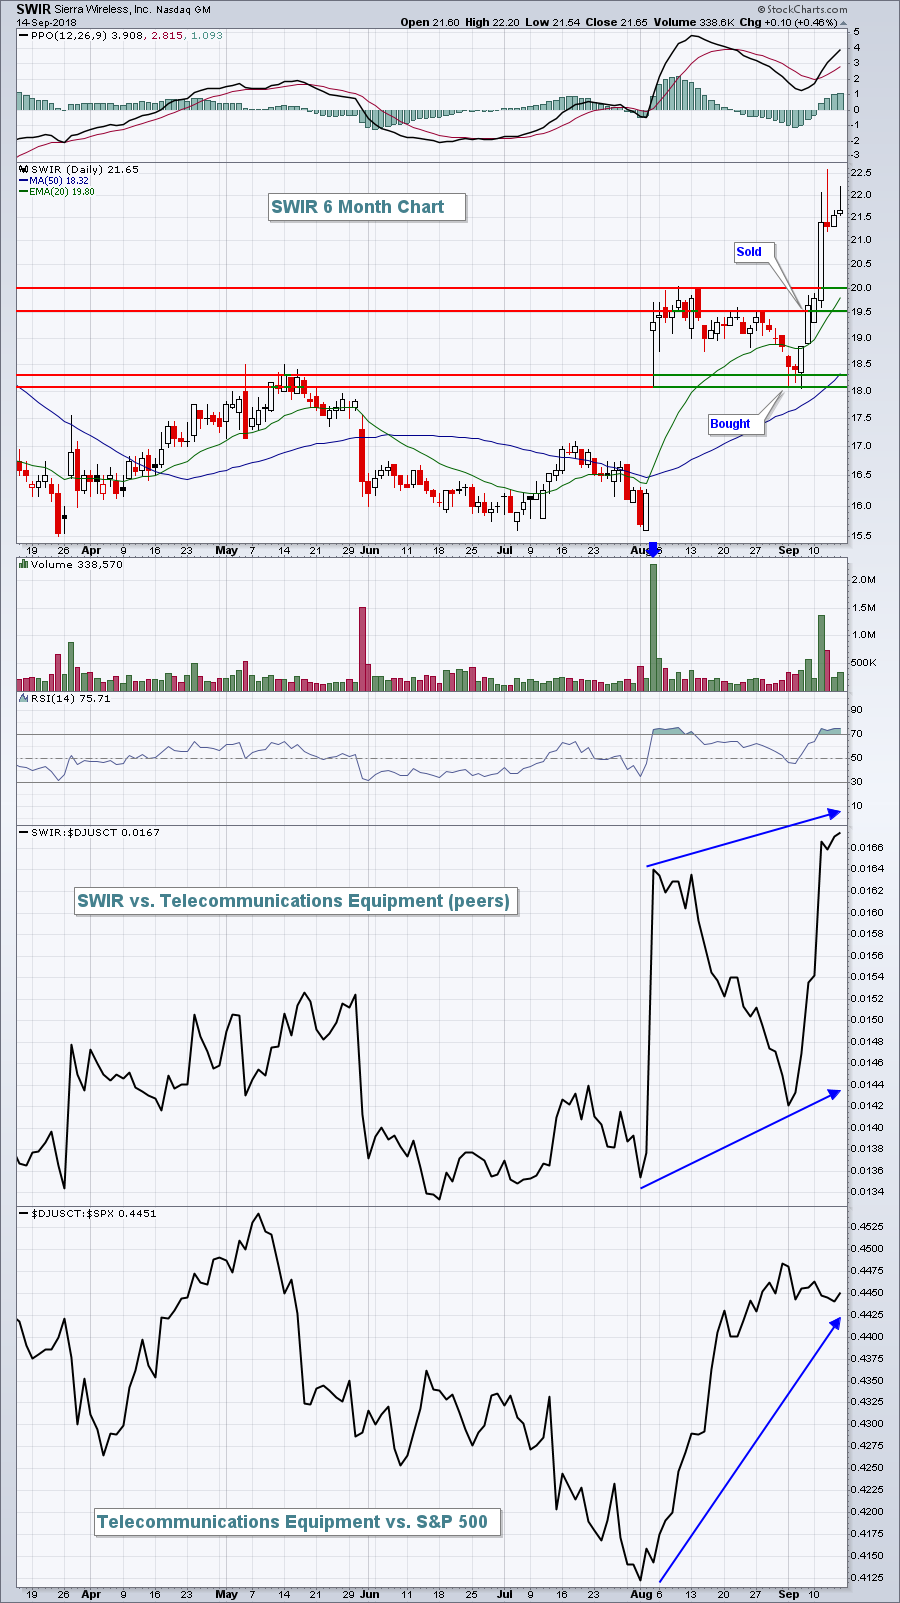
Check out the surge in price and volume when SWIR reported its quarterly results on August 2nd:
 SWIR jumped close to 20% in two days after reporting revenues of $201.9 million vs. $199.2 million (expected) and EPS of $.27 vs. $.21. Analysts reset their price targets on companies that are able to exceed expectations as growth rates begin to increase. But while all that is taking place on a fundamental basis, market makers are trying to get the best price possible for their institutional clients that want to accumulate shares in a growing company. That's why many stocks will pull back and consolidate for periods of time, frustrating traders who chased and bought near recent highs. As the frustration grows, traders sell and move on to another trade and market makers take advantage of this lack of patience, accumulating shares for their clients by buying those shares from impatient traders. This continues until institutional orders are filled and VOILA(!) the uptrend resumes! As a short-term trader, I try as best I can to avoid trading emotionally (chasing and panicking) and instead focus on buying close to support levels where I can maximize reward potential and minimize risk. Successful trading results from managing risk, not from hitting on every trade. Honestly, if I can be right 50%-60% of the time, I should perform quite well if I stick to managing downside risk (keeping stops in place).
SWIR was a trade that I recently made. Yes, I could have held it and made a ton more, but you never know when a stock is ready to break above resistance and when it will simply consolidate longer. If I could consistently make 7-8% on 3-4 day trades, that would work out nicely over time. Greed is a terrible emotion in the stock market that will eventually crush your portfolio. Market makers feast on those who trade based on fear and greed. Don't be one of those traders.
Happy trading!
Tom
