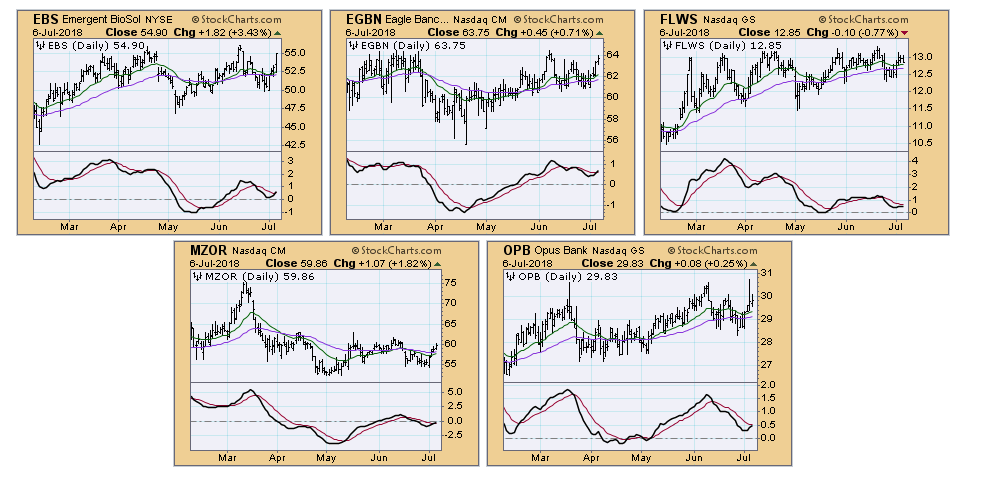
I've presented my favorite PMO scan numerous times during the MarketWatchers LIVE show, but also in articles. Here's a link to my article on that scan. However today I wanted to present my "Chart Breakouts" scan. I use this scan during the MarketWatchers LIVE show to find stocks or ETFs that are just beginning to breakout and also picking up momentum. Below is the CandleGlance of the chart breakouts I presented in today's show. Not all of these are great, but you can see that most have broken declining tops trendlines or above very short-term resistance.

It is necessary for you to have a subscription that allows you to create your own scans (Extra level or above). Below is the scan language that you can copy and paste into the scanning workbench:
// Narrows down the universe to US stocks with decent volume and a close above $10
[type = stock] AND [Daily SMA(20,Daily Volume) > 50000]
AND [country is US]
AND [Close > 10]
// This identifies a PMO that hasn't yet had a positive crossover its signal line
AND[today's PMO Line(35,20,10)<today's PMO Signal(35,20,10)]
AND [today's PMO Line(35,20,10) > yesterday's PMO Line(35,20,10)]
AND [yesterday's PMO Line(35,20,10) > 2 days ago PMO Line(35,20,10)]
AND [2 days ago PMO Line(35,20,10) > 3 days ago PMO Line(35,20,10)]
// Stock is in a "bull" market - 50-EMA higher than 200-EMA
AND [today's ema(50,close) > today's ema(200,close)]
// Stock just had a 5-EMA positive crossover 20-EMA - Short-Term bullish
AND [today's ema(5,close) X today's ema(20,close)]
I've added comment lines to the scan language above so you can understand what each line of code means. I basically took my PMO scan and took out the SCTR requirements and then added a 5/20-EMA positive crossover. That final line of code is what finds breakouts. Typically, a chart breakout is accompanied by one of these Short-Term Trend Model crossovers.
Once you have the results from your scan, you'll want a place to store your results so you can properly analyze them. Borrowing a great idea from Greg Schnell, I have a ChartList called "** Scan Dump **". The asterisks ensure it will be near the top of my ChartLists for easy access to 'dump' results there temporarily. I then call them up in CandleGlance (just like the graphic at the beginning of this article). At that point it's time to sift through the results. I've done a workshop on how to do this that you can find on the StockCharts YouTube channel. General directions are to look for strong PMO setups (rising, nearing a crossover, above the zero line if possible, not overbought, etc.) and for recognizable chart patterns.
The culled results from today brought six stocks to my attention. Of those results above, my top two are Emergent BioSolutions (EBS) and Mazor Robotics (MZOR), both from the Healthcare sector.
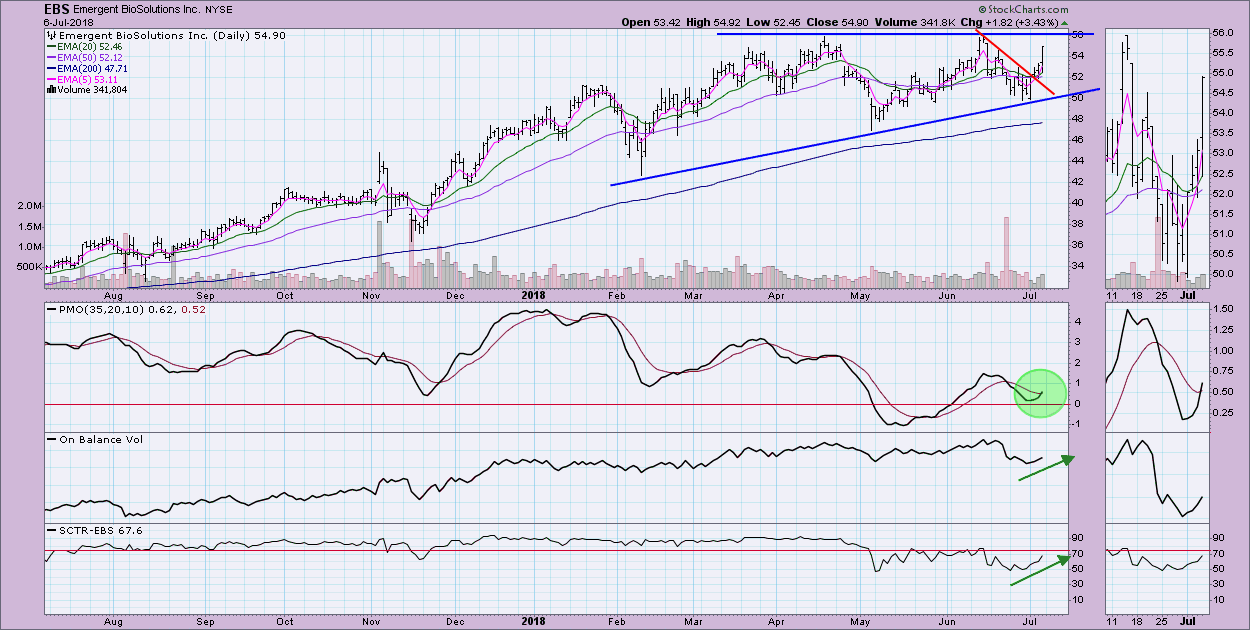
EBS shows the breakout from a ST declining tops trendline and a larger ascending triangle. The biotech space is heating up again and having a stock in this space might be a good idea. The PMO has just triggered a BUY signal and both the OBV and SCTR are rising nicely. I might try to be patient and wait for a pullback off this huge leap today, but certainly one to add to your watchlist at a minimum.
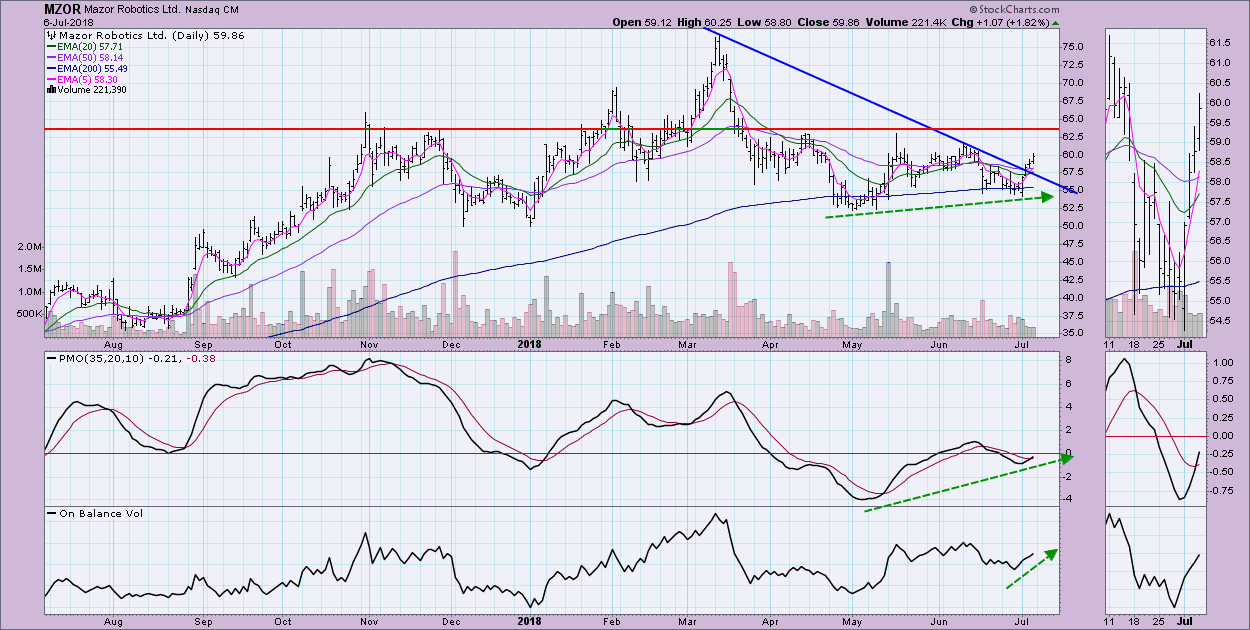
 Also in the Healthcare sector we find Mazor Robotics (MZOR). This week we saw a breakout from an intermediate-term declining tops trendline. The PMO is showing a strong bullish confirmation as PMO bottoms are rising steeply as price bottoms rise slowly. I would look for a move to test overhead resistance around $64.00.
 Conclusion: While all results from these scans are not guaranteed, they should all show some sort of a breakout, either from declining tops trendlines or short-term horizontal resistance. As with all of the scans I present, tweak them, comment out parameters you don't want in order to enlarge the pool of results and have fun. I find scanning to be one of THE most helpful StockCharts tools for finding investment opportunities.
Technical Analysis is a windsock, not a crystal ball.
Happy Charting!
- Erin
Helpful DecisionPoint Links:
DecisionPoint Shared ChartList and DecisionPoint Chart Gallery
Price Momentum Oscillator (PMO)
Swenlin Trading Oscillators (STO-B and STO-V)
**Don't miss DecisionPoint Commentary! Add your email below to be notified of new updates"**
