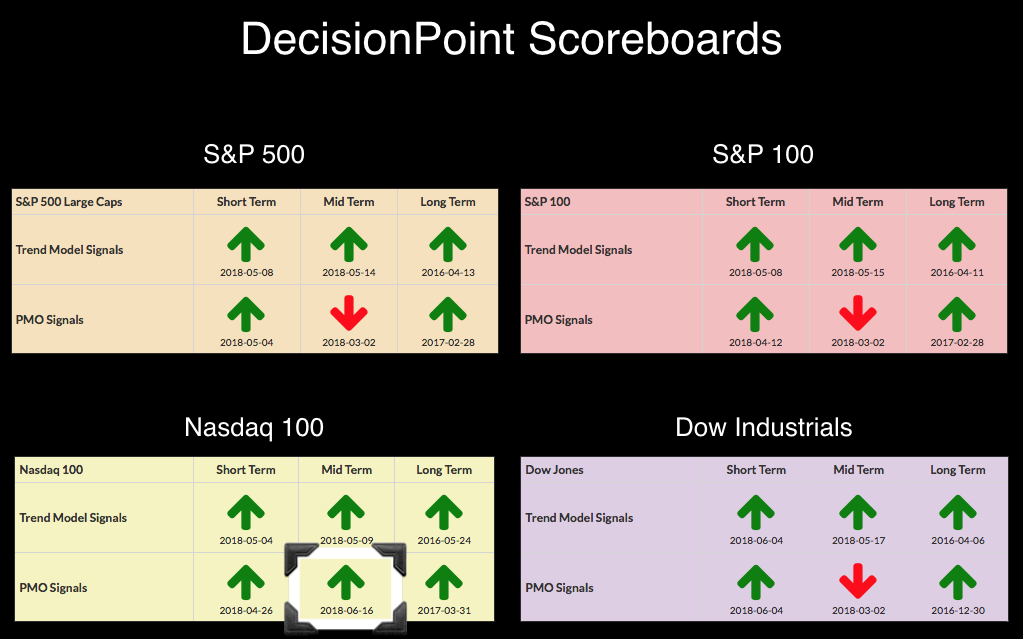
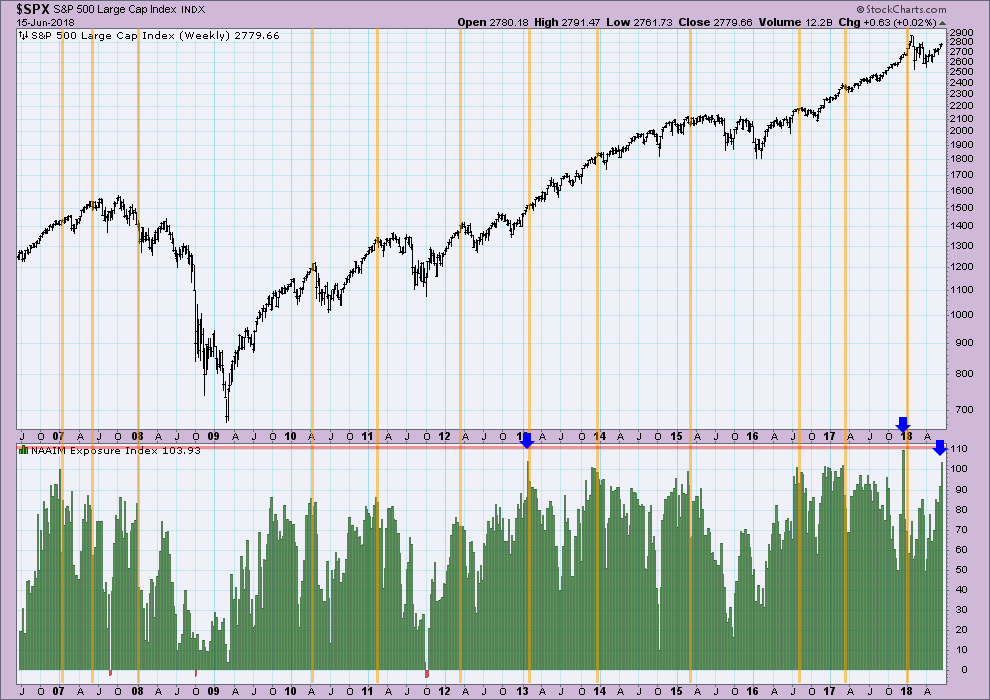
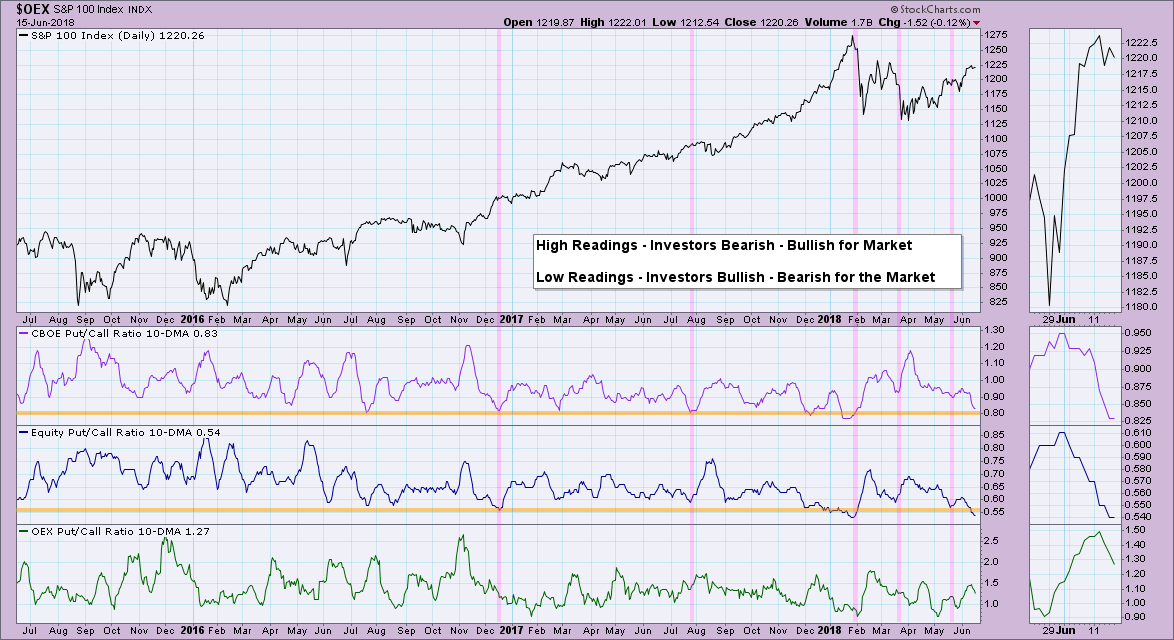
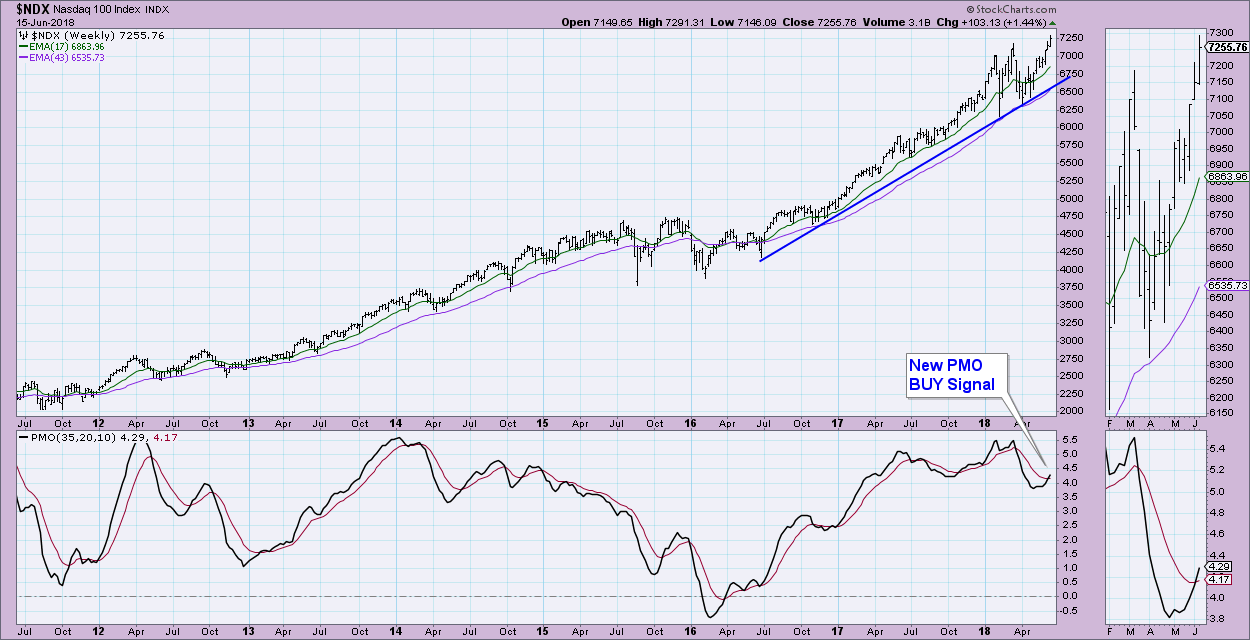
On Friday, the weekly charts went "final". With that finalization, the NDX which had been carrying a positive Price Momentum Oscillator (PMO) crossover throughout the week, finally posted the IT PMO BUY signal on its DP Scoreboard. Additionally, sentiment charts were very interesting this week. The National Association of Active Investment Managers (NAAIM) posted the 3rd highest market exposure reading since it started in 2006 and put/call ratios are at multi-year lows.

High readings on NAAIM suggests excessive bullishness. I've annotated the many times these readings have led to either a decline or consolidation depending on the strength of the market. Remember that bullish participants is bearish for the market.
The 10-DMA of the Put/Call Ratios is moving to extreme lows which suggests market participants are very bullish. Sentiment being contrarian, this is very bearish for the market.
The NDX isn't caring much about the excessive bullishness, closing up 1.44% for the week and hitting new all-time highs. However, sentiment does suggest this is not going to continue. The PMO BUY signal on the weekly chart is encouraging. A pullback would not likely cancel it out. The other three Scoreboard indexes are on their way to the same crossover BUY signal on their weekly charts as well; they have a larger margin to tackle.
Conclusion: Despite an intermediate-term PMO BUY signal on the NDX, sentiment charts are showing excessive bullishness accompanying this move to all-time highs. NAAIM exposure reached an historic high and put/call ratios are at multi-year lows which is highly bearish for the market.
Technical Analysis is a windsock, not a crystal ball.
Happy Charting!
- Erin
Helpful DecisionPoint Links:
DecisionPoint Shared ChartList and DecisionPoint Chart Gallery
Price Momentum Oscillator (PMO)
Swenlin Trading Oscillators (STO-B and STO-V)
**Don't miss DecisionPoint Commentary! Add your email below to be notified of new updates"**


