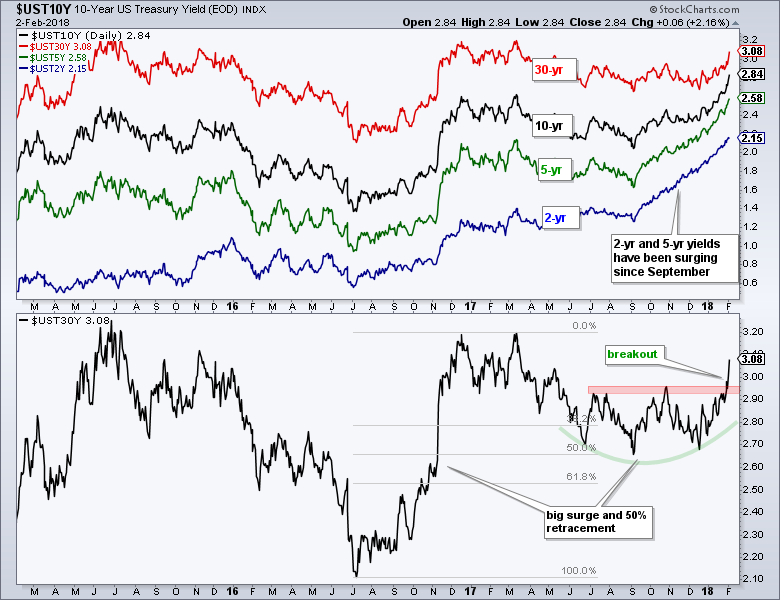
 Short-term Treasury yields have been moving sharply higher since September with the 5-yr and 2-yr yields hitting multi-year highs over the last few months. Yields at the long end of the curve are lagging, but appear to be catching up finally as the 10-yr yield broke out in January and the 30-yr yield broke out this week.
The chart below shows the 2-yr, 5-yr, 10-yr and 30-yr yields on one scale in the top window. This same-scale feature makes it easy to compare relative yields and spot the movers. The 2-yr yield (blue) moved straight up from September to early February and moved above 2% for the first time since September 2008. Yes, it looks like the bond market is finally getting back to normal.
The lower window shows the 30-yr yield breaking out and resuming the prior advance. The yield surged from 2.1% to 3.2% from July to December 2016, and then corrected with a 50% retracement back to the 2.7% area. A rounding bottom formed over the last six months and the 30-yr yield broke out with a big move this week.
Using the measured move technique, this breakout targets a move to the 3.8% area. The first advance measured 1.1% (2.1% to 3.2%). We can then add this amount to the correction low for a target (1.1% + 2.7% = 3.8%). This would put the 30-year yield back near the 2013 highs, but still well below the 2009-2010 highs, which were near 4.8%.
The bond market, as always, is leading the Fed and the Fed will ultimately play catch up. More importantly, we are seeing a watershed moment in the bond market as the long-term bear market in yields reverses. A rising yield environment will favor banks going forward. On the side, rising yields could be negative for utilities and REITs.
Plan Your Trade and Trade Your Plan.
- Arthur Hill, CMT
Senior Technical Analyst, StockCharts.com
Book: Define the Trend and Trade the Trend
Twitter: Follow @ArthurHill

