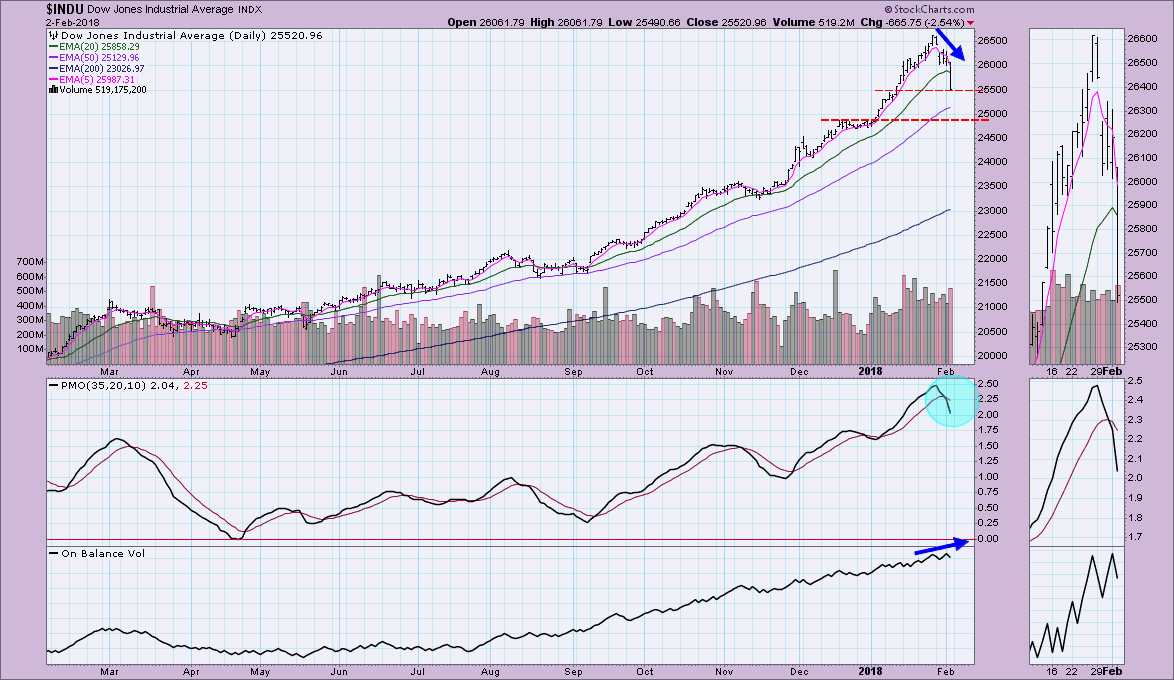
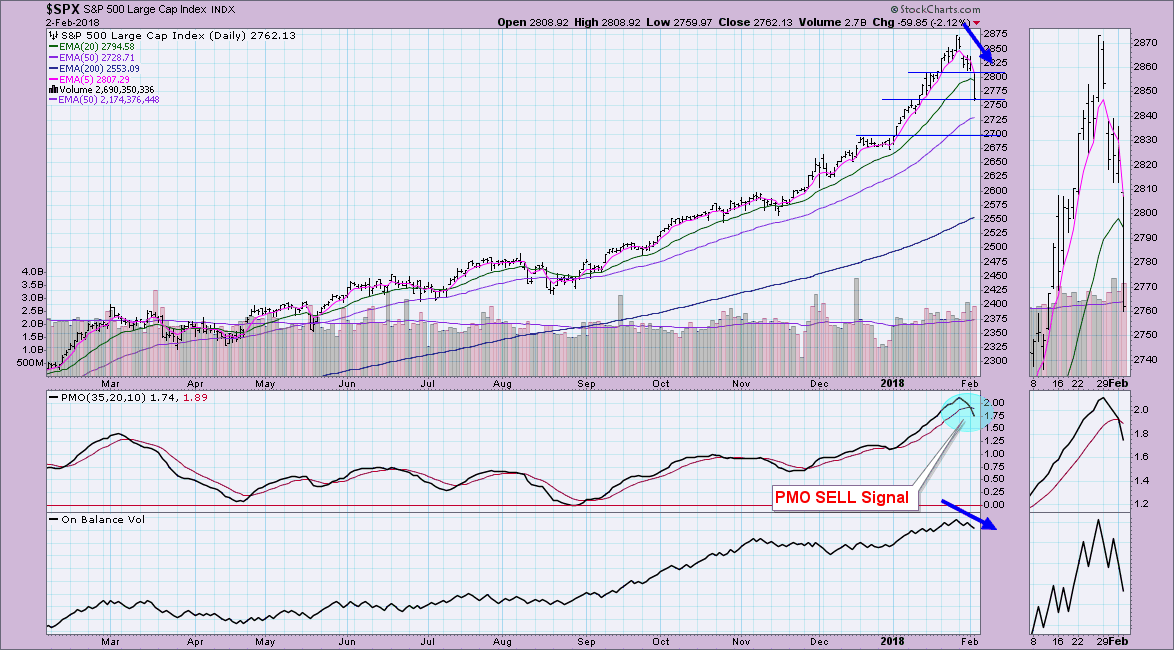
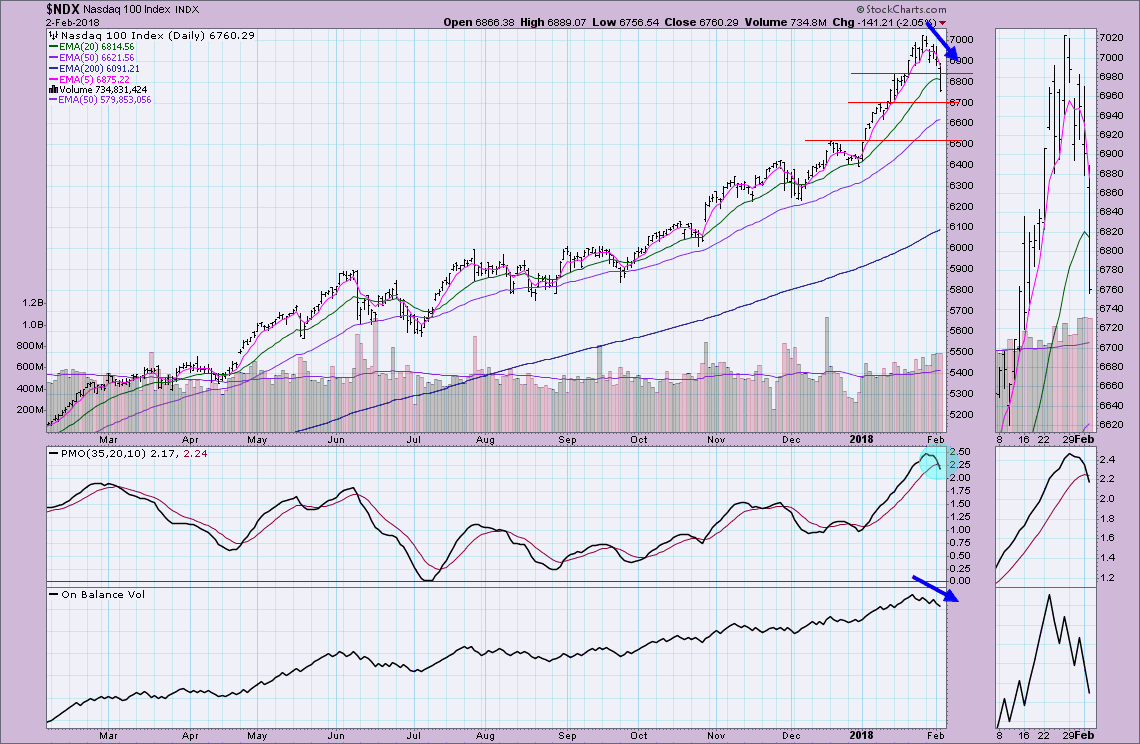
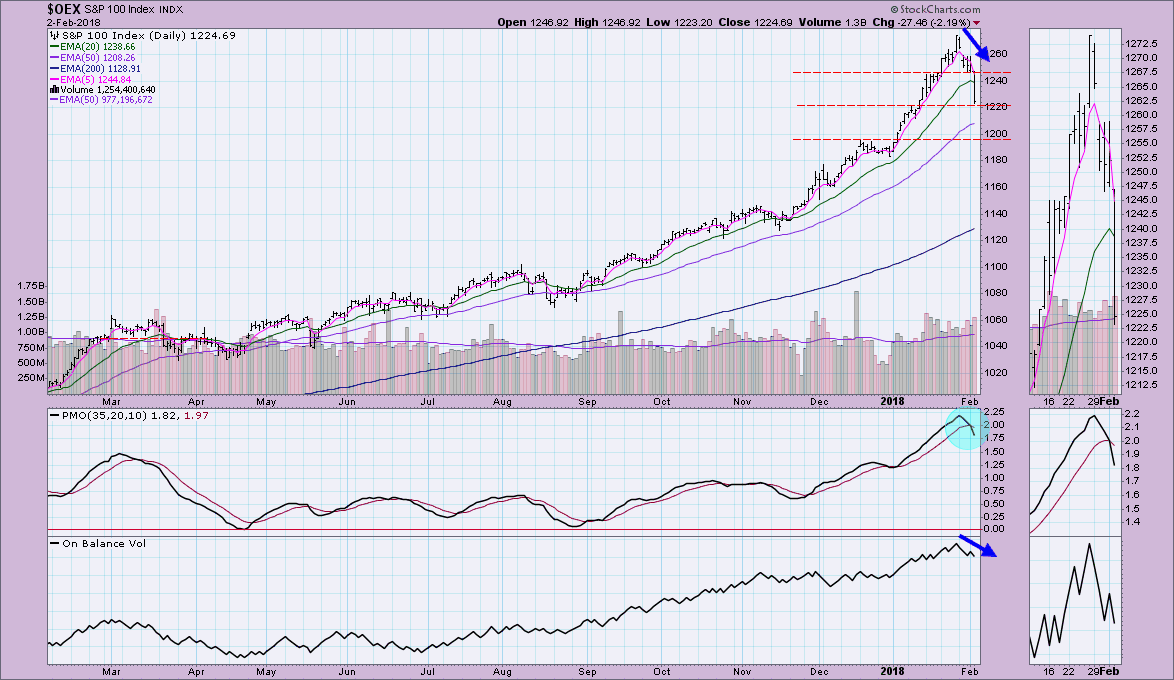
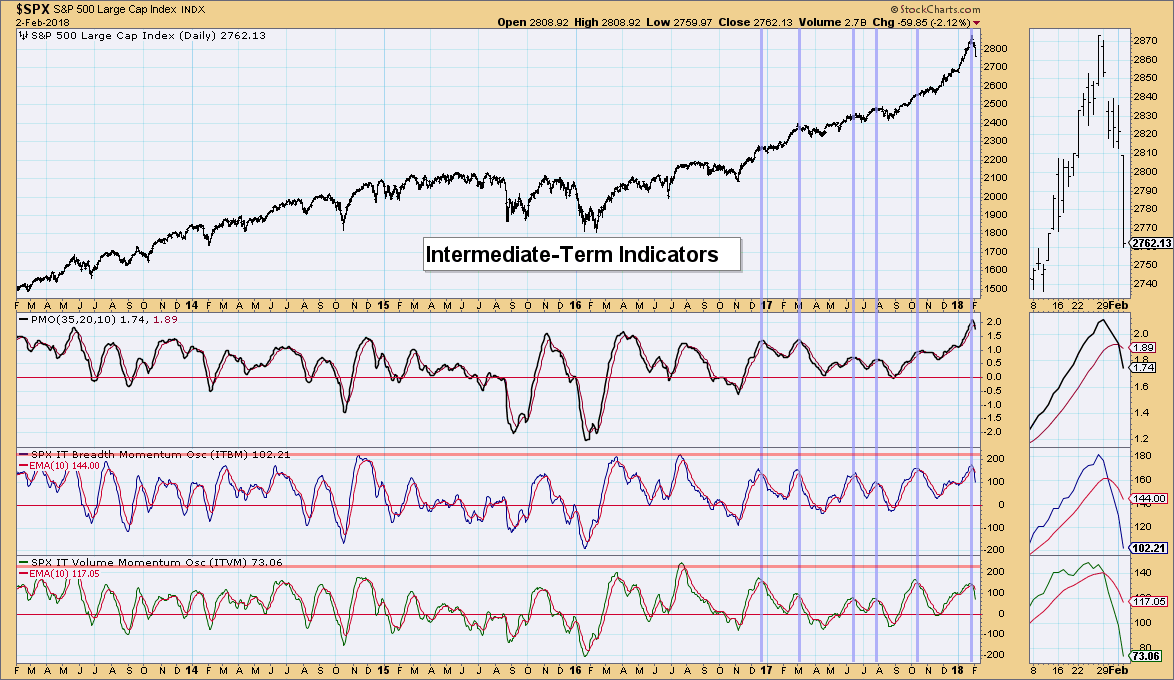
It's been nearly a month since we saw our last signal changes to the DecisionPoint Scoreboards, but with the pullback over the past week, momentum turned negative and now we are seeing new Price Momentum Oscillator (PMO) SELL signals on all four!
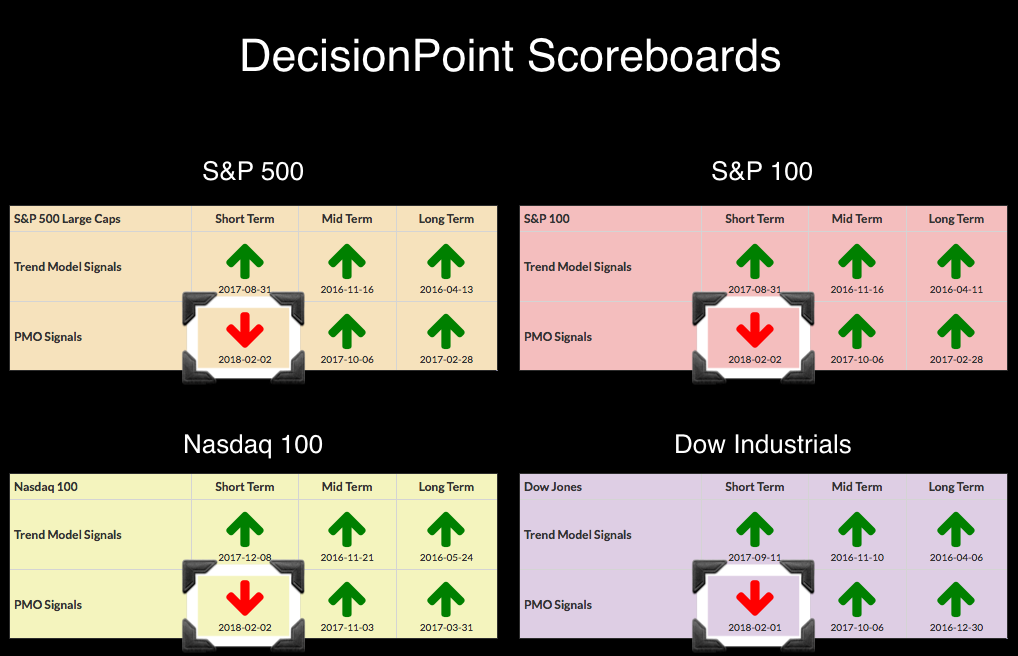
The Dow actually incurred its PMO SELL signal yesterday, but flew under my radar. The additional three PMO SELL signals landed on the boards today. On all four of the index charts below, I've marked various areas of support. In all four cases, they have now landed on intermediate-term support, but unfortunately, there is plenty of room for them to move lower to stronger support.
For the Dow, the next area of strong support would be at about 24,750 or so. This would also have price testing or perhaps breaking below the 50-EMA. The good news is that price stopped at this support level and could hold up. The OBV doesn't look too bad as we see declining price tops but rising OBV tops.
The SPX is also now on its support line after today's difficult decline (well, difficult for us, but apparently easy for the market). Carl and I have both been watching the 2700 level as the strongest area of support should the parabolic rally breakdown. The OBV is showing a bearish confirmation.
The NDX hasn't yet reached its secondary support line but it did drop well below the 20-EMA. In the case of the NDX, the OBV looks terrible and is showing a bearish confirmation.
The OEX nearly landed on support, but clearly the strongest area lies around 1200. The OBV on the OEX is also concerning.
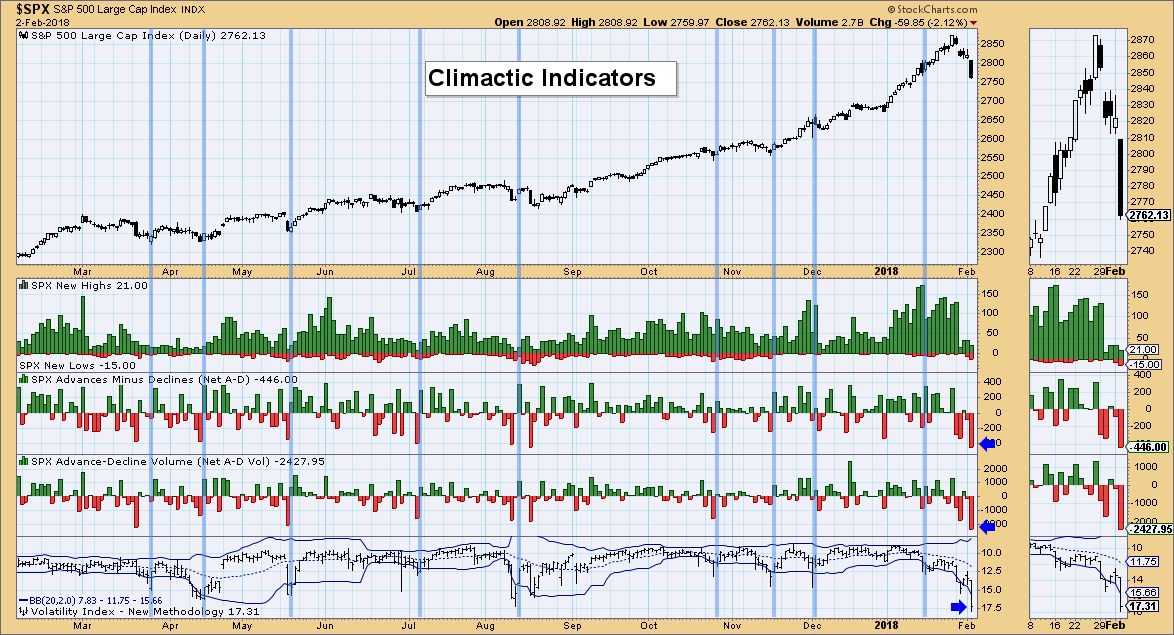
In all cases of these four major indexes, the rally has been parabolic. As in most parabolics, when they correct it can be fast and quite painful. The PMO SELL signals and OBV bearish confirmations suggest there may be more downside ahead, but bearish sentiment exploded today and that usually results in a rally. Note the climactic breadth readings and very high VIX reading. This generally results in a rally pop and sometimes the beginning of a new uptrend.
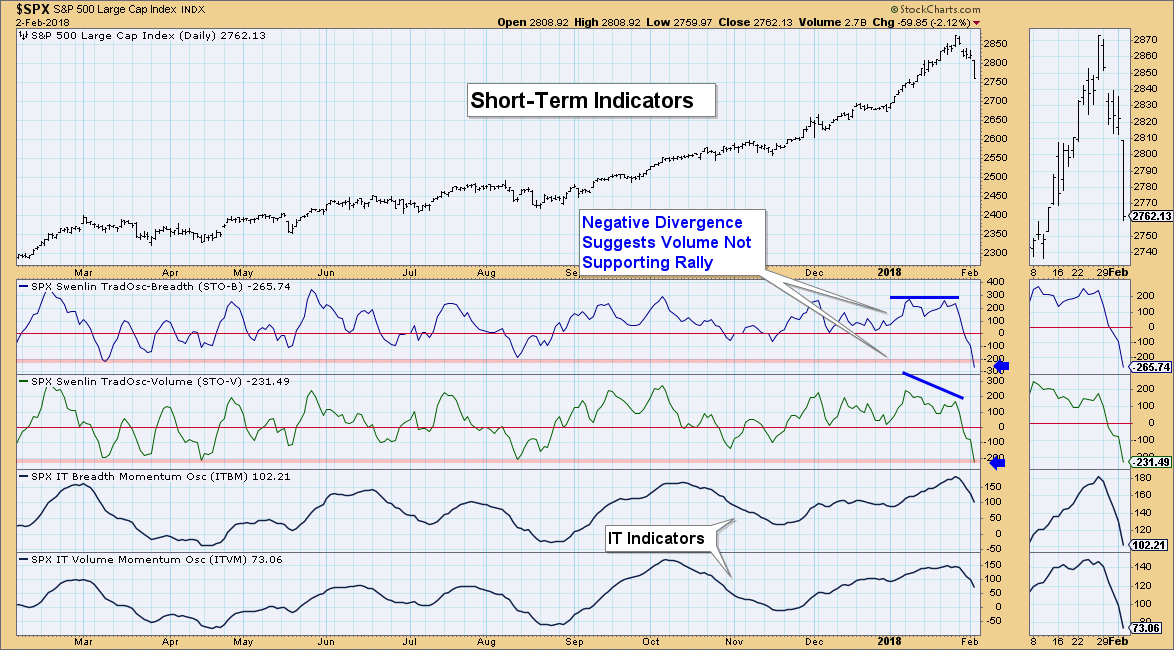
These indicators are remarkable in their quick descent into extremely oversold territory! They're at readings lower than we've seen all year. Apparently the negative divergence I mentioned this week was prescient as the decline came right off that divergence. At this point, they are so oversold I would expect some upside next week. The IT indicators in the bottom two panes are very negative and the IT indicator chart shows us that the overall correction may not be over quite yet as they need further unwinding.
Today was an especially tough pill to swallow. Anytime you see the major indexes dropping so quickly it is going to make you uneasy. However, I think our short-term indicators are suggesting a bit of respite before the decline likely continues based on the IT indicators.
Helpful DecisionPoint Links:
DecisionPoint Shared ChartList and DecisionPoint Chart Gallery
Price Momentum Oscillator (PMO)
Swenlin Trading Oscillators (STO-B and STO-V)
Technical Analysis is a windsock, not a crystal ball.
Happy Charting!
- Erin
**Don't miss DecisionPoint Commentary! Add your email below to be notified of new updates"**

