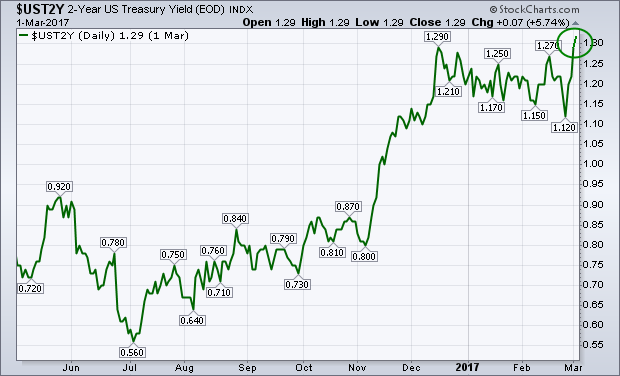
Chart 1 shows the 2-Year Treasury yield climbing above 1.30% on Thursday, for the first time in seven years. That shorter term yield is more sensitive to the potential for a rate hike than longer-range maturities. That suggests that fixed income traders are taking expectations for a March rate hike by the Fed more seriously. Fed fund futures Wednesday placed the odds for a March hike near 66%. That suggests that bond yields in general are probably headed higher as well. That's also giving a big boost to the U.S. dollar.
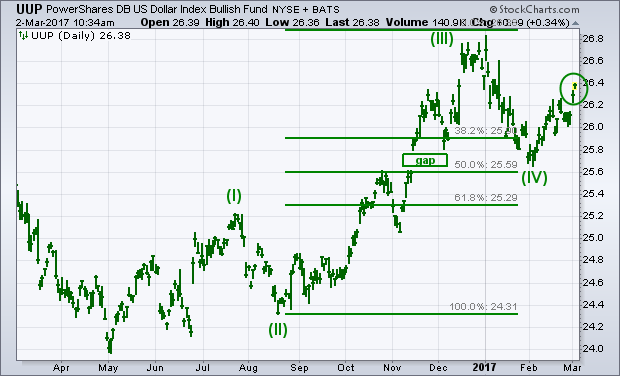
 Chart 2 shows the U.S. Dollar Index ETF (UUP) climbing to the highest level in six weeks. The dollar is following the 2-Year Treasury yield higher on increased expectations for a March rate hike. Chart-wise, the UUP was due for an upturn anyway. Previous messages showed the UUP having retraced 50% of its August/January rally, which put it in a logical support point. Chart 2 also shows "gap support" formed in mid-November right after the election (see box). One final point. The numerals show that the UUP has been in a "wave four" Elliott wave correction since the start of the year. Uptrends usually have five waves. That makes the 2017 decline a correction in an ongoing uptrend. That increases the odds that a "wave five" advance is starting.

