ChartWatchers February 18, 2017 at 07:03 PM
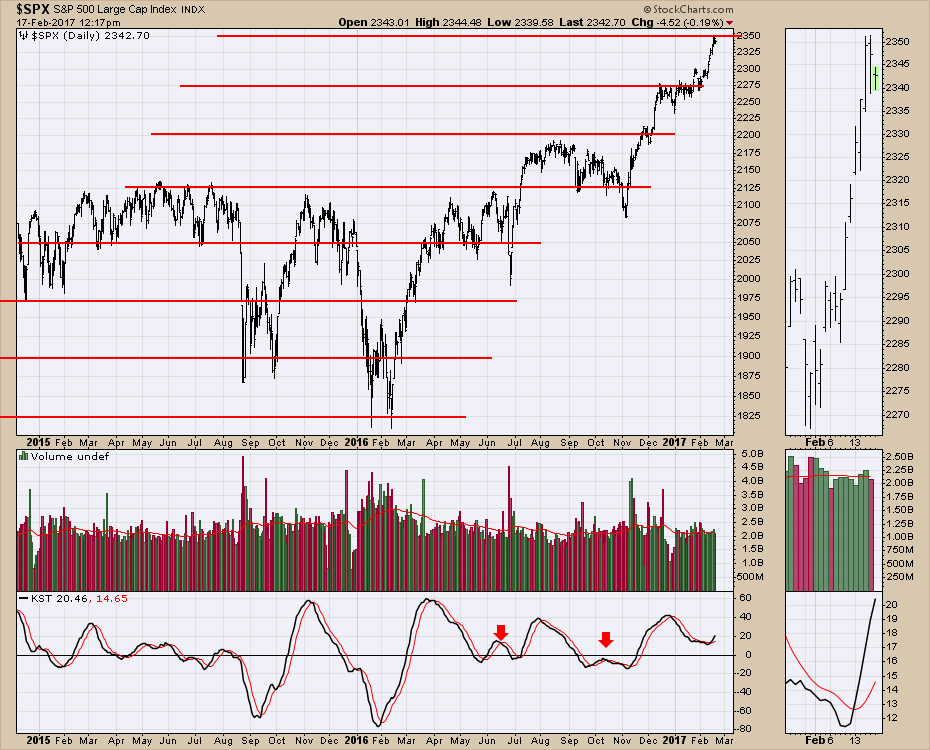
The $SPX has had a nice ladder effect going on recently. Much like the origins of technical analysis found in the early days, the market tends to move forward in ranges. These areas have been quite obvious recently... Read More
ChartWatchers February 18, 2017 at 05:08 PM
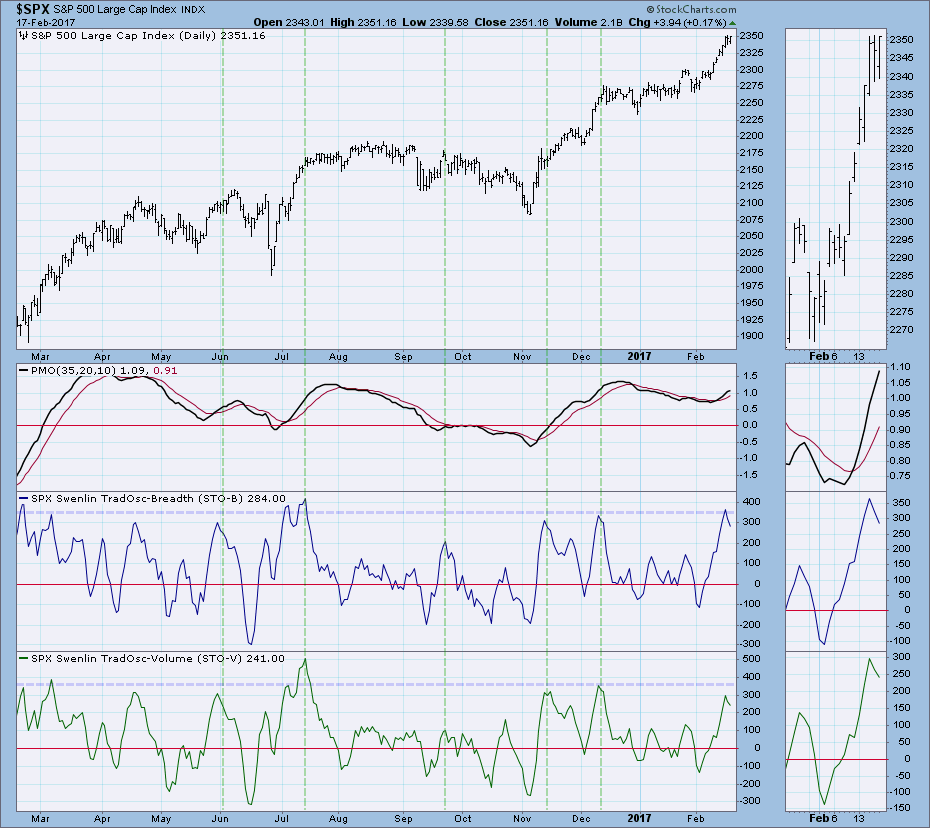
The market has been experiencing an almost vertical rally over the past few weeks, but it has cooled over the past two days. The steep rising trend pushed our short-term Swenlin Trading Oscillators (STOs) into highly overbought territory... Read More
ChartWatchers February 18, 2017 at 03:46 PM
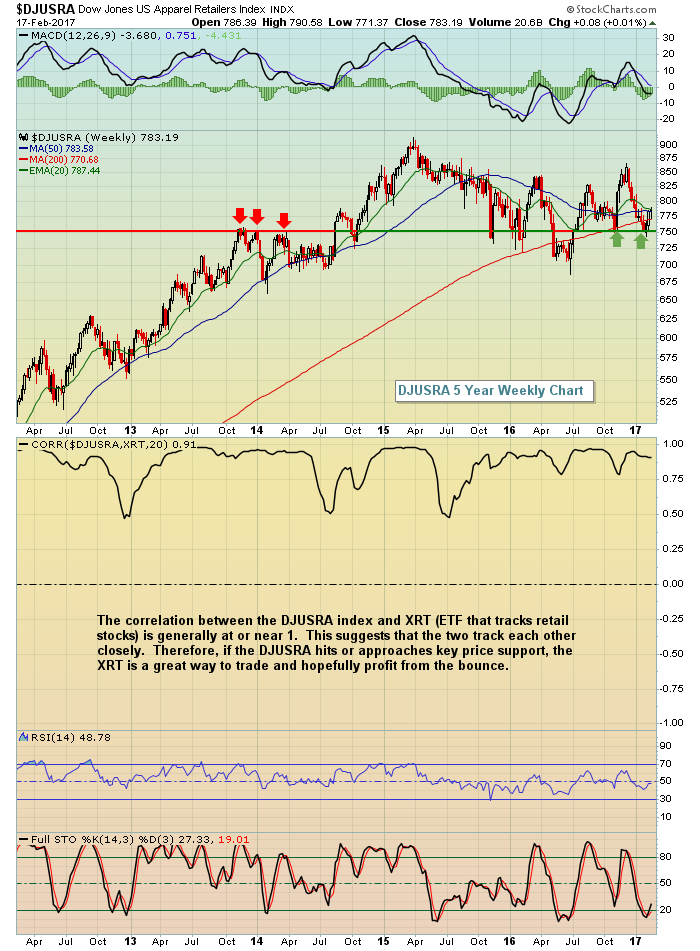
About a month ago, I wrote a ChartWatchers article detailing the bullish historical tendencies of retailers during the months of February, March and April. In particular, apparel retailers ($DJUSRA) have shown tremendous bullishness during the months of February, March and April... Read More
ChartWatchers February 17, 2017 at 07:17 PM
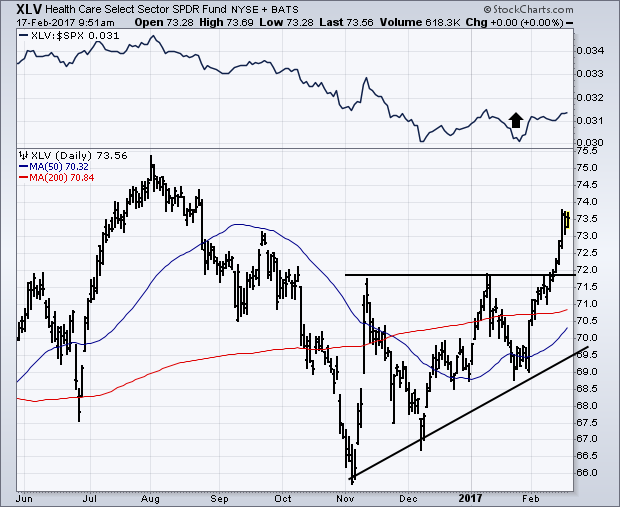
In case you haven't noticed, the Health Care SPDR (XLV) has taken a bullish turn. Chart 1 shows the XLV breaking out of a bullish "ascending triangle" that I described in my February 4 message. At the same time, the XLV/SPX ratio (top of chart) appears to be bottoming... Read More
ChartWatchers February 17, 2017 at 06:17 PM
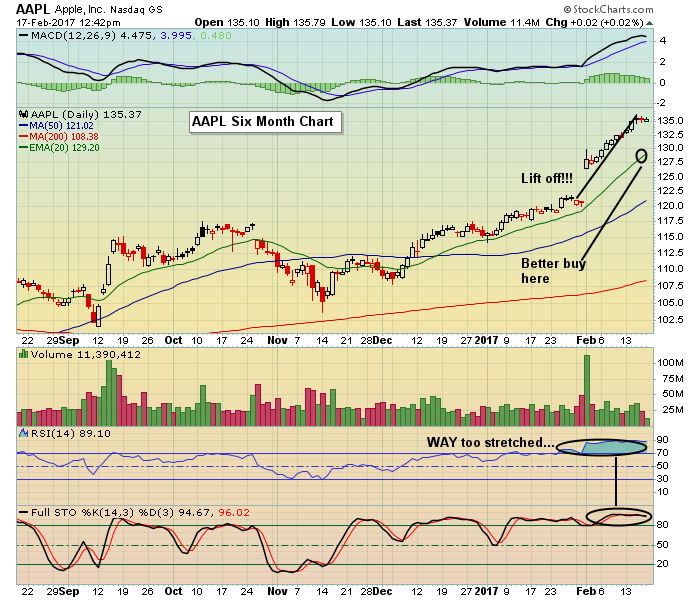
I made my case to EarningsBeats members this past Wednesday just before we started to see a bit of selling. Here are the highlights: 1-The VIX is up by almost 9% today as it tests its 50 day moving average from the downside even though the market is higher... Read More
ChartWatchers February 17, 2017 at 05:11 PM

Just like potato salad in the fridge, support and resistance levels for the S&P 500 have a shelf life and become stale over time. The value of the S&P 500 is based on the price of its individual component stocks... Read More
ChartWatchers February 04, 2017 at 05:36 PM
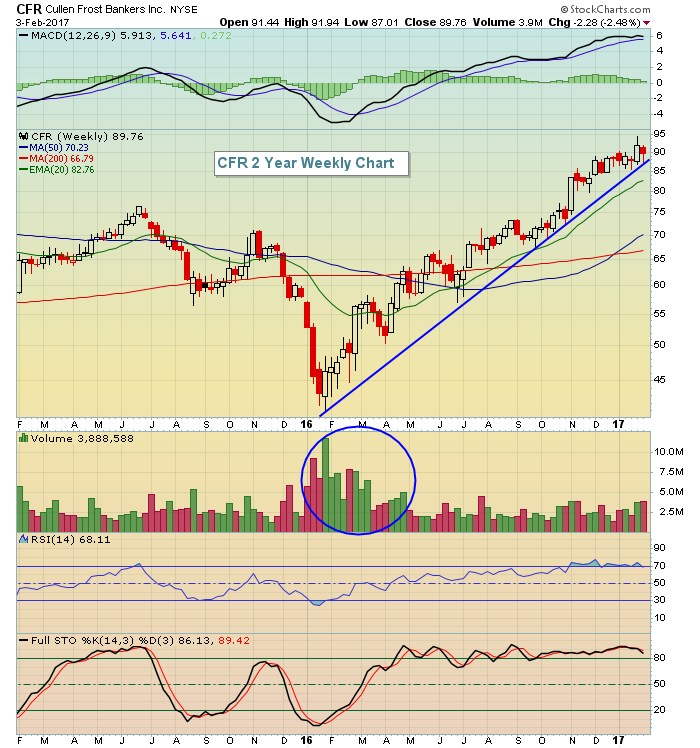
Exercising patience and discipline to enter trades at appropriate reward vs. risk levels is obviously very important to any trader's success, but planning trades before they set up is just as important. Let me give you a few examples... Read More
ChartWatchers February 04, 2017 at 04:13 PM
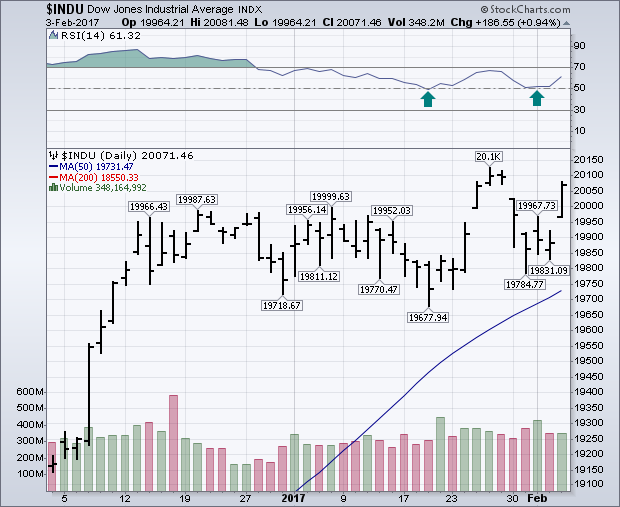
What started off as a soft week for stocks ended on a strong note. Friday's gain was enough to keep stock indexes basically flat for the entire week. But there was some improvement on the charts. The daily bars in Chart 1 show the Dow Industrials jumping 186 points (0... Read More
ChartWatchers February 04, 2017 at 08:50 AM
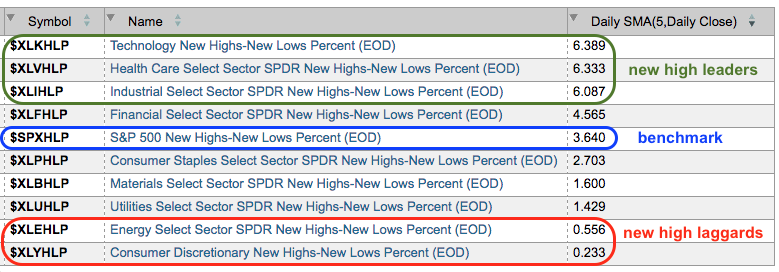
New highs are a sign of underlying strength and chartists can measure this indicator using High-Low Percent. In particular, I like to rank the nine sectors by High-Low Percent or a moving average of High-Low Percent... Read More
ChartWatchers February 03, 2017 at 09:09 PM
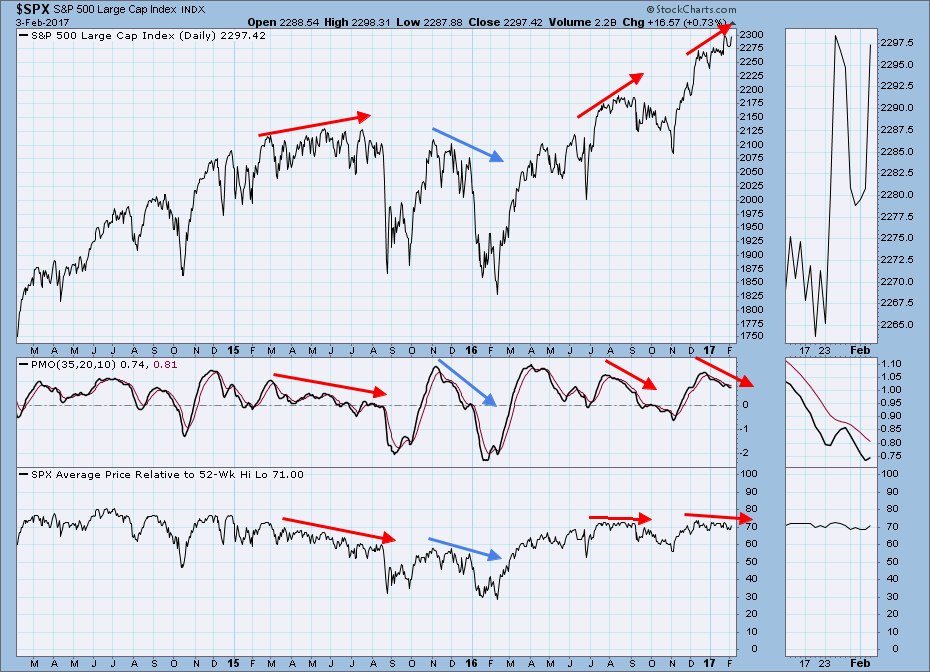
Today during my DecisionPoint Report webinar, I pulled the intermediate-term indicator chart of SPX Stocks Relative to Their 52-Week Hi-Lo to show my viewers the divergences that are all over this chart... Read More
ChartWatchers February 03, 2017 at 06:41 PM
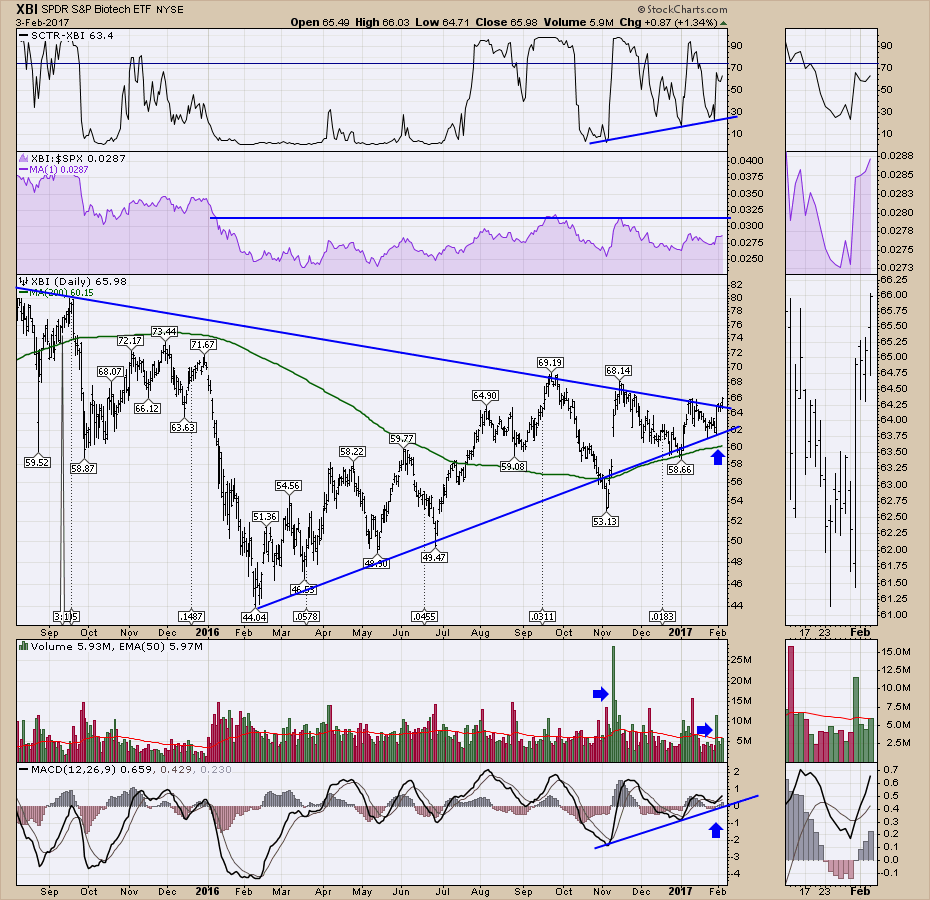
The Biotech arena has been a "House Of Pain" for investors while the companies continue to deliver all sorts of pain remedies to people worldwide. But the pattern shaping up on the Biotech ETF's suggests they are one to watch closely... Read More
ChartWatchers February 03, 2017 at 02:08 PM
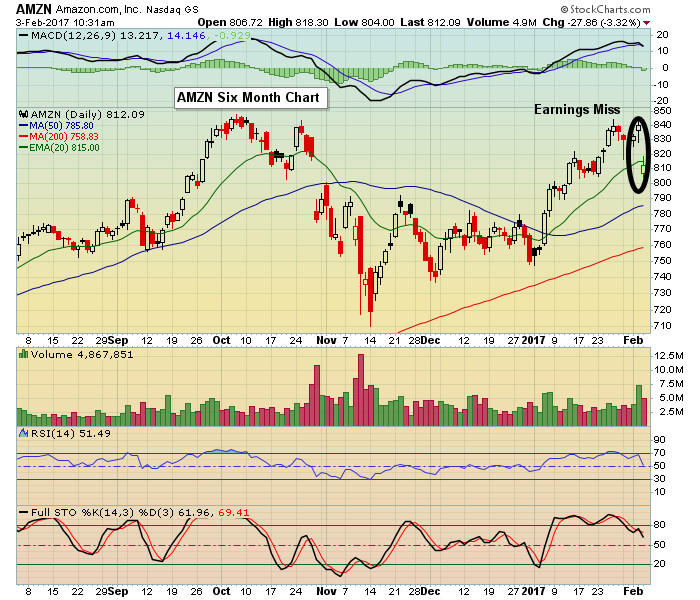
At EarningsBeats we are steadfast in avoiding being involved in stocks into a company's earning's report because one can never tell how the market will respond to a company's numbers. Case in point is Amazon who reported their numbers last week... Read More