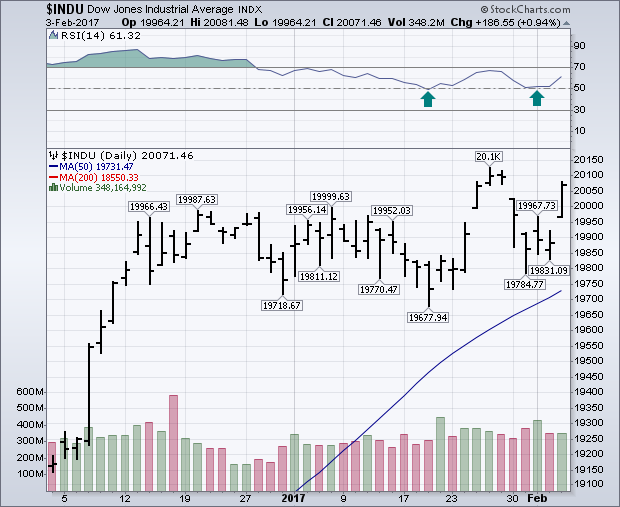
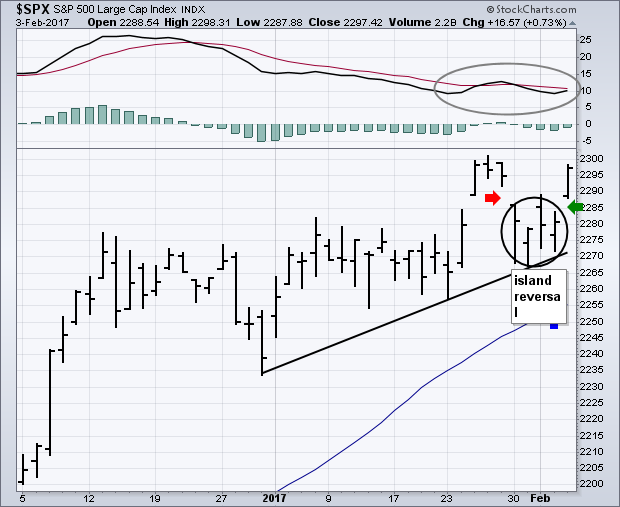
What started off as a soft week for stocks ended on a strong note. Friday's gain was enough to keep stock indexes basically flat for the entire week. But there was some improvement on the charts. The daily bars in Chart 1 show the Dow Industrials jumping 186 points (0.94%) on Friday. That was more than enough to keep it well above its 50-day average and chart support along its January low. Also encouraging was its 14-day RSI line (above chart) bouncing off the 50 level for the second time since mid-January. That's usually a sign of market that's consolidating rather than correcting. The only soft note on Friday was volume, which didn't match the price gains. The S&P 500 also saw improvement. Chart 2 shows the SPX jumping 16 points (0.73%) on Friday. If you look closely at the circled part of the graph, you can see a bullish short-term pattern called an "island reversal". That pattern is formed when a "gap down" (red arrow) is followed within a few days by a "gap up" (green arrow). That pattern usually signals higher prices. My Thursday message expressed concern that the two MACD lines for the SPX had yet to turn positive. The box on top of Chart 2, however, show the two MACD lines converging for the second time in two weeks. It wouldn't take much to turn them positive. Also encouraging was the fact that financials led Friday's rally. So did small caps and transports.


