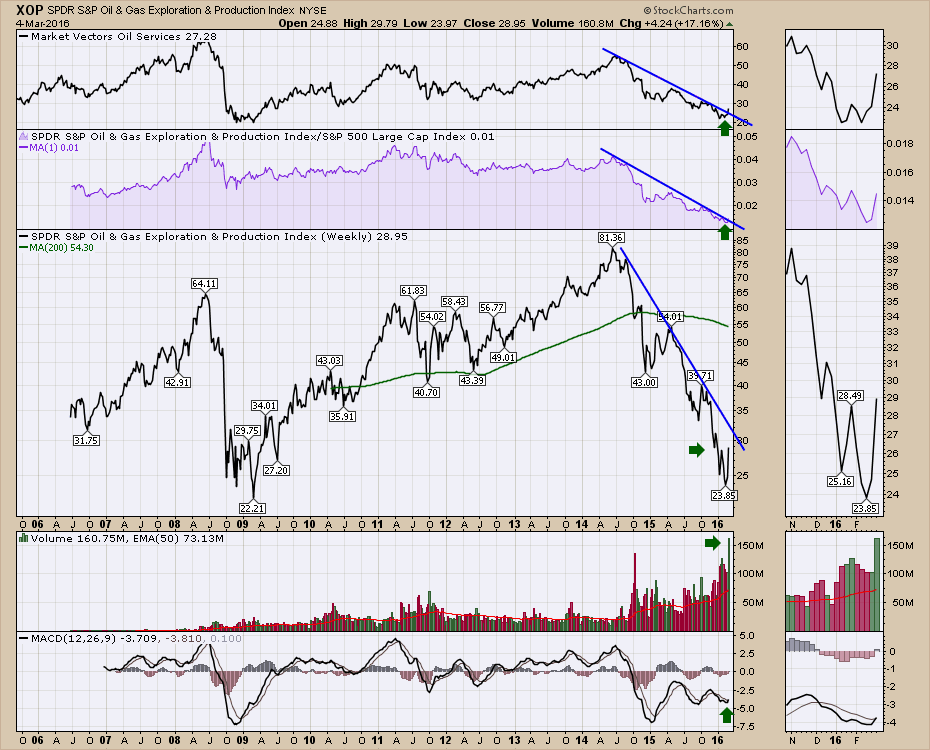
This week did a lot to shake my resolve on the continuing bear market in the energy sector. Let's look at three charts and discuss why they are at critical levels. The OIH (US Oil Services ETF) has broken the downtrend for the first time since oil topped and started to break down. The Relative Strength closed just above the trend line on Friday. If nothing else, it indicates a change in trend for the XOP. The actual price of the XOP has now made a higher high but is still well below the trend line. The extreme volume shows a huge level of interest. We can also see the MACD gave a positive cross this week. This is easier to see by looking in the zoom box.
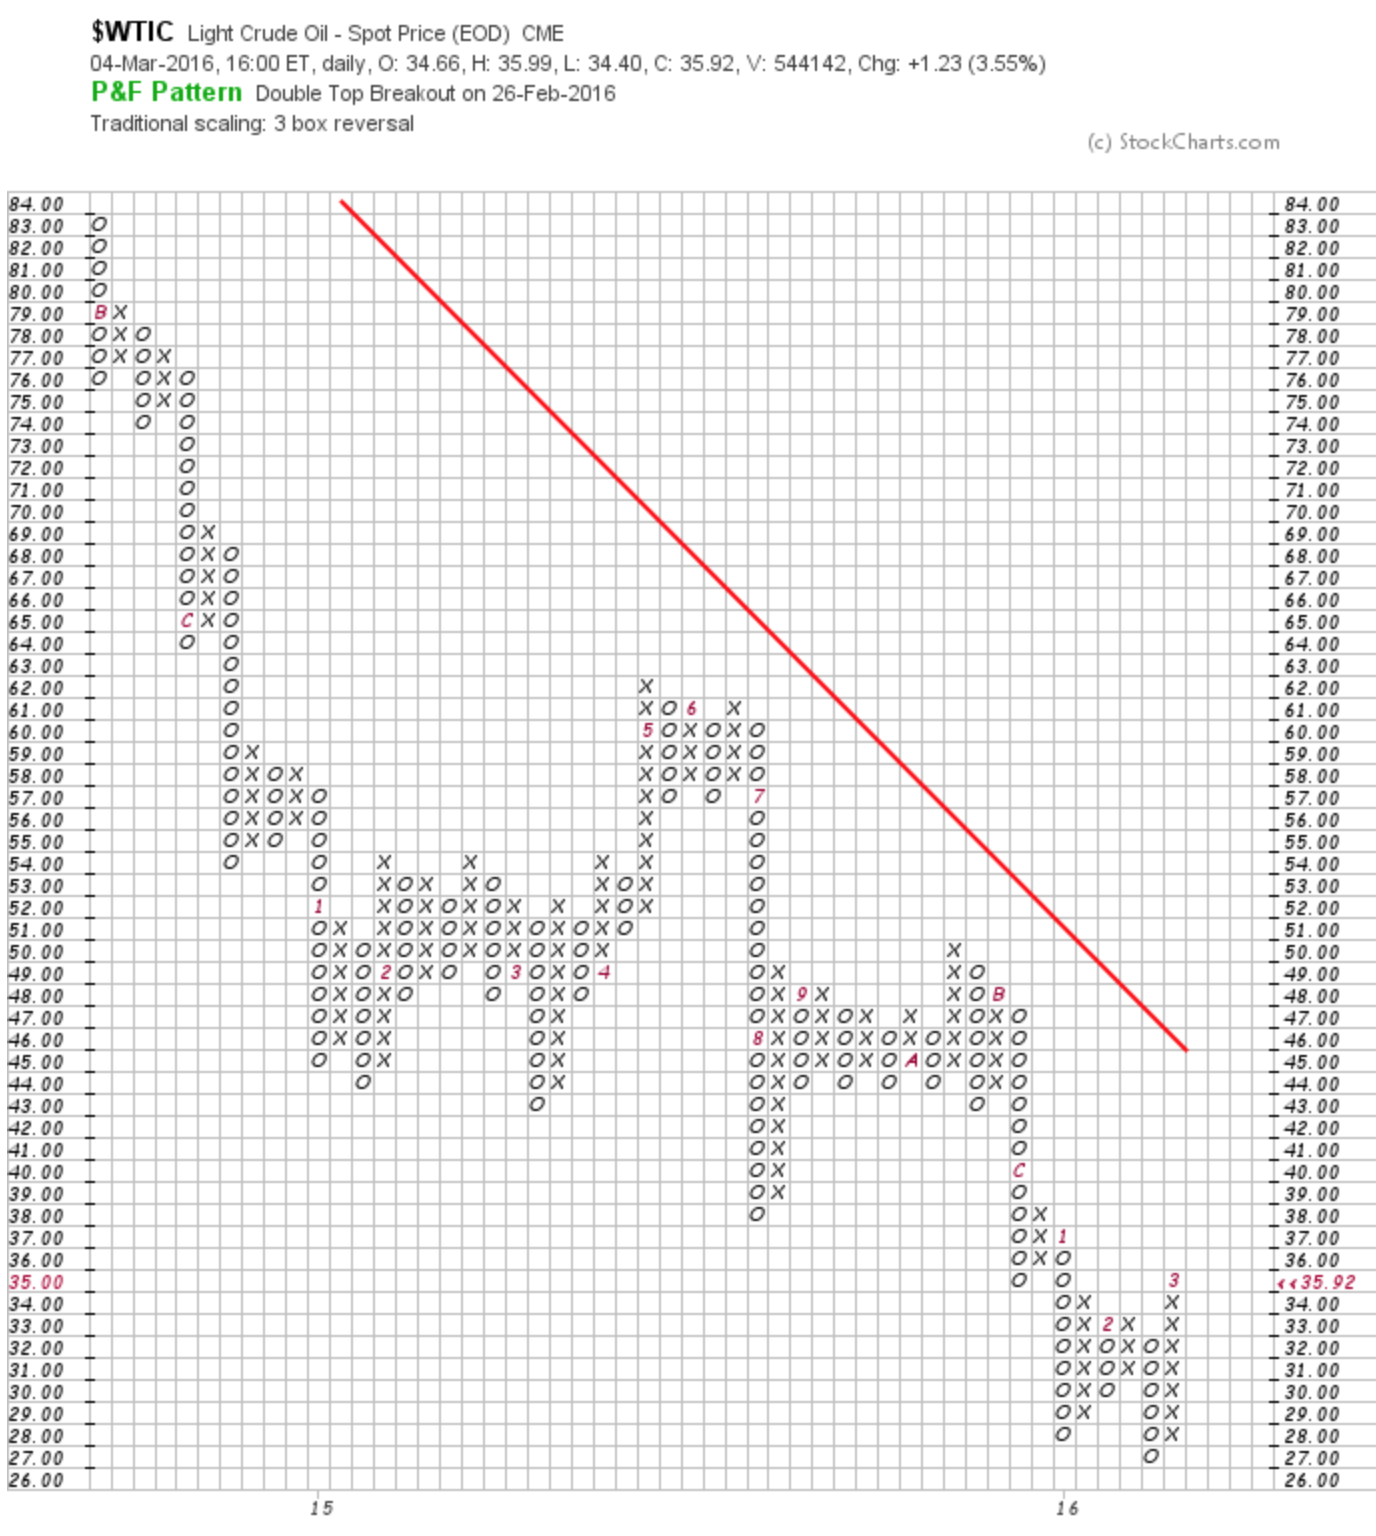
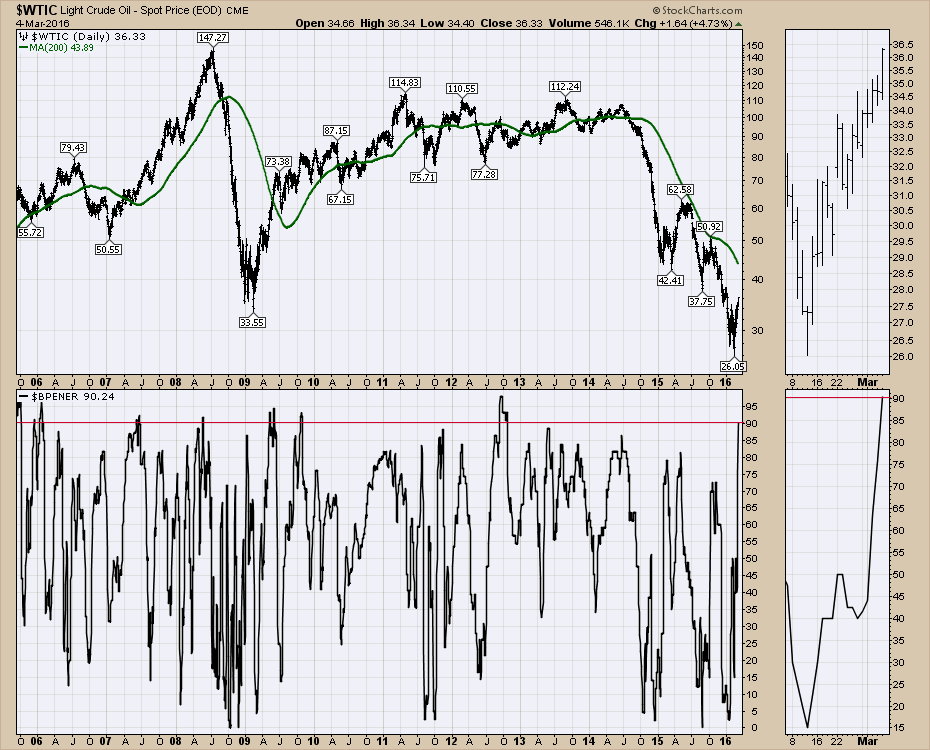
Secondly, the price of oil made a higher high. The question will be how crude traders will handle the resistance at $37-$38 level. We still don't have a higher low, so this should still be a basing pattern.
 Lastly, the Bullish Percent Index for Energy ($BPENER) broke out to the highest level since the price of oil topped. This level is extreme, which could indicate the start of a new bull market.
 The number of stocks that were starting to have high SCTR rankings is still not huge. But without question, the oil stocks should be on your radar. I did a webinar on Thursday, March 3rd, discussing how to get setup for a breakout in crude stocks. If you are looking for a method of technical analysis to buy into the oil sector, click on this link to see the webinar. Commodities Countdown 20160304.
Good trading,
Greg Schnell, CMT, MFTA.

