Let me preface this article by defining bull and bear markets according to DecisionPoint. DecisionPoint considers 50/200-EMA crossovers the distinguishing factor between a bull market and bear market. These crossovers are what determine the Long-Term Trend Model signals. We have two of the major indexes covered in the DP Chart Gallery (non-members only have access to SPX) in "bull markets". The Nasdaq 100 never actually had the negative 50/200-EMA crossover so it has remained in a bull market even through the August correction. I thought it would be interesting to see some of the major index charts focused on the 50/200-EMA crossovers. What I'd like you to hone in on is the margin between those EMAs and how soon they could move lagging indexes into 'bull markets'.
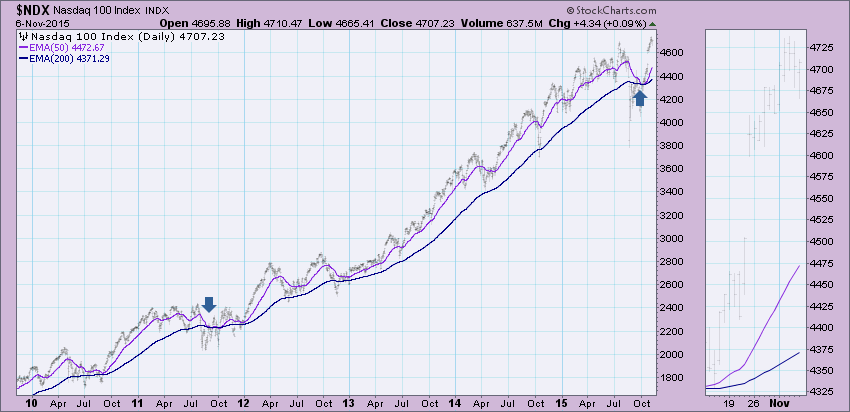
Remember the NDX never experienced a DecisionPoint bear market. You can see how close the 50-EMA came to a downside crossover the 200-EMA...it missed it by less than a tenth of a point.
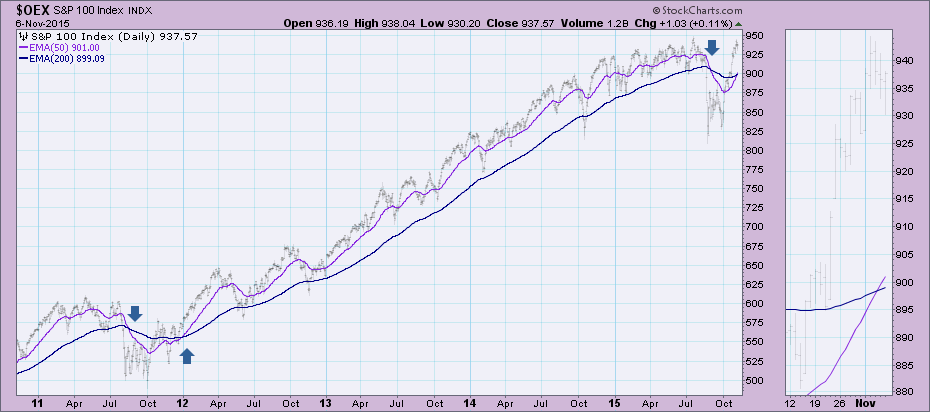
The OEX switched to a Long-Term Trend Model BUY signal yesterday. I wrote an article in the DecisionPoint Blog about this change that I recommend you check out.
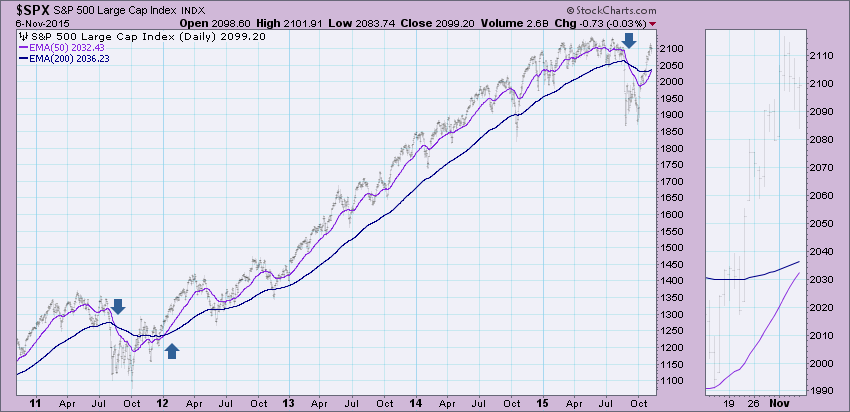
The S&P 500 is the closest of the four DP Chart Gallery indexes (SPX, NDX, Dow and OEX) to switching from a bear market into a bull market. Clearly when the 50-EMA began its rise the tail end of this rally was probably occurring. These signals are great for determining bullish and bearish bias, they aren't however, quick to respond to price movement, they are slow moving averages after all, so I don't use them as timing signals necessarily. Longer-term investors should have better performance using the weekly chart Price Momentum Oscillator (PMO) crossovers, combined with Intermediate-Term Trend Model signal changes.
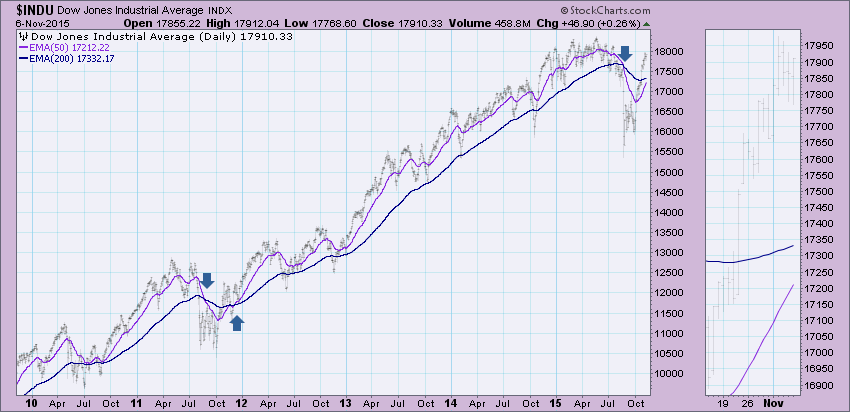
The Dow is actually the laggard of the group. The correction was deep, taking out the October low. Consequently, the 50-EMA plummeted and has taken longer to recuperate. Price on the Dow is not yet testing overhead resistance at all-time highs. The problem for the Dow is that should price experience the very much needed pullback, the 50-EMA may be prevented from that upside crossover which would technically leave it with a bear market bias.
Conclusion: The DP Scoreboards are moving from red arrows (SELL) to green arrows (BUY) which is characteristic of new bull market phases. With most indexes pushing against technical and psychological resistance near the all-time highs, a pullback is needed. This would entice money from the sidelines to participate in the next rally. That money will be needed for a break above overhead resistance at the all-time highs and the formation of new support above them.


