Trading stocks is never for the faint of heart. It requires great skill and discipline to consistently succeed. For those who believe technical analysis is an important part of trading, learning to read and interpret charts is a very important part of the equation.
Understanding technical analysis alone does not guarantee positive results. In fact, one could argue that some traders spend too much time trying to perfect their chart reading skills while ignoring everything else that must be considered in order to make a successful trade.
For example, you might be superb at identifying key support and resistance levels, but what good does it do you if you constantly ignore honoring stop losses that then lead to substantial losses?
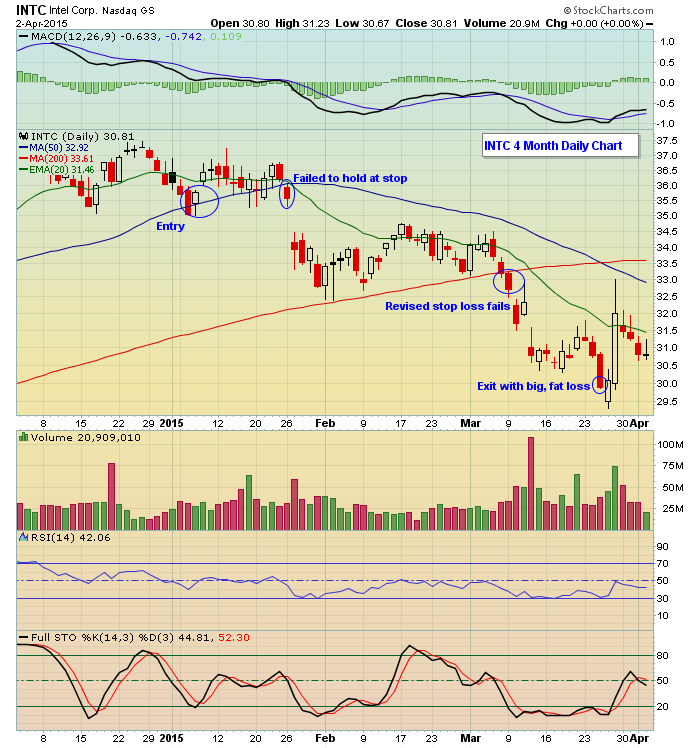
Take a look at the chart below on Intel. Imagine you decided to take a long position when the stock pulled back to its 50 day moving average in early January. You did this because you felt the 50 day provided solid support and liked the risk/reward potential and you committed to yourself that if the stock closed back below the 50 day you would exit the trade without much of a loss. But the stock kept dancing around at the 50 day so you decided to give it just a little more wiggle room so you wouldn't exit "prematurely." But you waited just a little bit too long, missed another very important negative technical development as the 20 day crossed below the 50 day, and watched the stock drop significantly as it then tested its 200 day moving average. By that point you were down big so you decided to adjust your stop down to the 200 day moving average as you believed it would provide great support. But when the 200 day failed to hold, you finally had enough, cried uncle and exited the position with one big, fat loss.

So you see, your original analysis was correct; the 50 day was a critical level of support; you had nailed it. And if you had exited there as you had committed in the first place, it would have been an acceptable loss. You then had a second chance to exit at your revised stop, but you ignored that as well. Instead, your losses kept mounting to the point where you finally threw in the towel, pretty much making your original analysis worthless.
Of course it didn't need to end that way and you can see how important it becomes to remain disciplined at all times. This is the very good news! You can fix something like this by trusting your good work and sticking with your original game plan. Honestly, it's as simple as that.
Speaking of spotting key technical developments that can be used to your advantage, our Chart of the Day for Monday, April 6 is an major index chart that's at a "Make or Break" point. If you're not already getting our FREE Chart of the day, just click here to sign up and I'll send you a new annotated chart every morning before the opening bell.
Committed to helping you succeed,
John Hopkins
President
Invested Central
