I use this ChartPack during every trading day. It is absolutely invaluable and a "must-have" for any of you who tend to find yourself glued to StockCharts when the market is open. The beauty of this ChartPack, it is only one ChartList, so for any of you that are running short on List space, this one won't really cut into your space like some of our more indicator rich ChartPacks.
The DecisionPoint Intraday ChartPack can be downloaded quite easily from "Your Account" page. For more detail on downloading and installing a DecisionPoint ChartPack, you can read the blog article I wrote with step-by-step instructions.
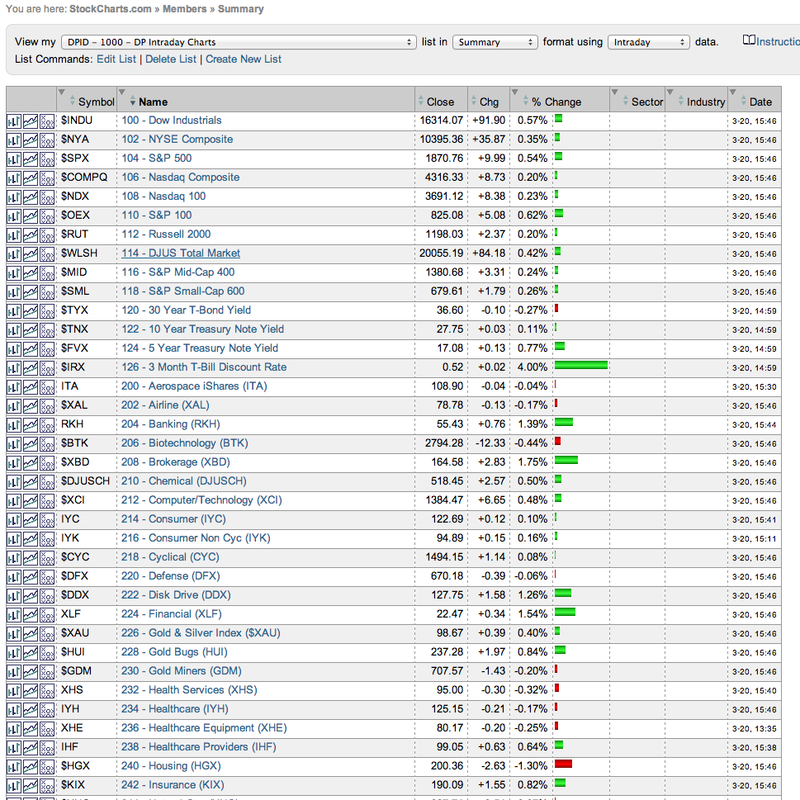
Below is a partial list in summary view of what is included in this ChartPack:
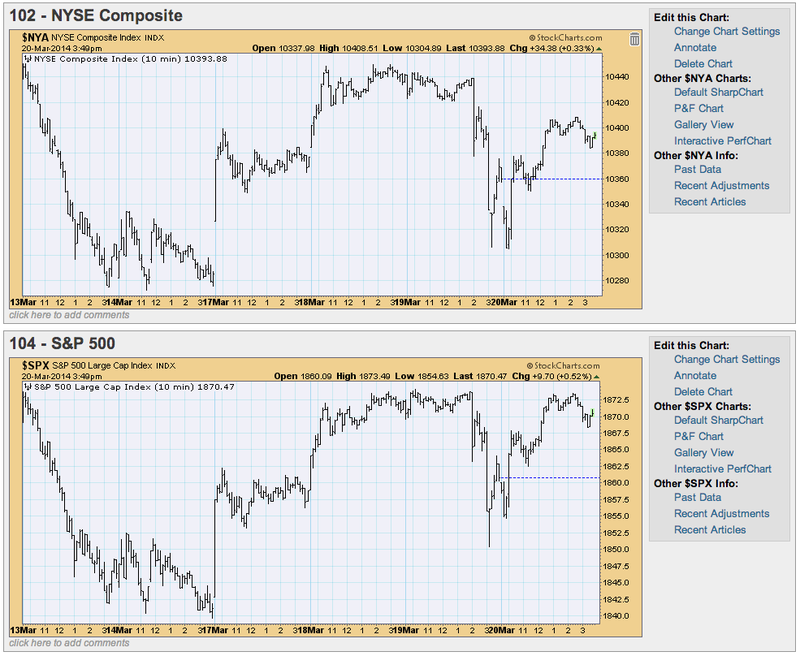
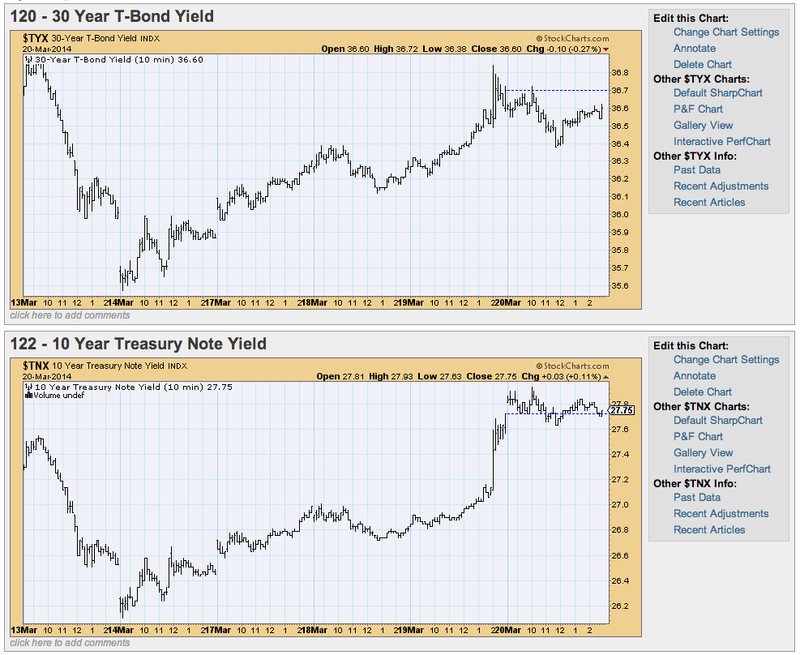
Why do I use the intraday list so frequently? It is a complete up to the minute picture of all of the major indexes and sectors in one place. This ChartPack contains a 10-minute bar chart for a period of the last six trading days for each chart. A horizontal line is drawn at the previous day's close so you can quickly see the health of that index or sector. I open it in a 10-per page view for quick analysis. Below are a few sample charts.
You can see how this gives you an even better visual of ultra-short-term market trends than a table. The market summary page, while useful just can't show you more than today's change.
I usually keep the Intraday ChartList open in a tab in my browser that I can refresh and look at constantly as the data is updated. These charts are extremely valuable if you are watching market action throughout the day. Plus these are much easier to follow than the ticker tape and side summaries on your favorite financial channel!
Don't miss this ChartPack! And remember, if you aren't as enamoured of it as I am, you can uninstall the ChartPack quickly and easily.
Happy Charting,
Erin


