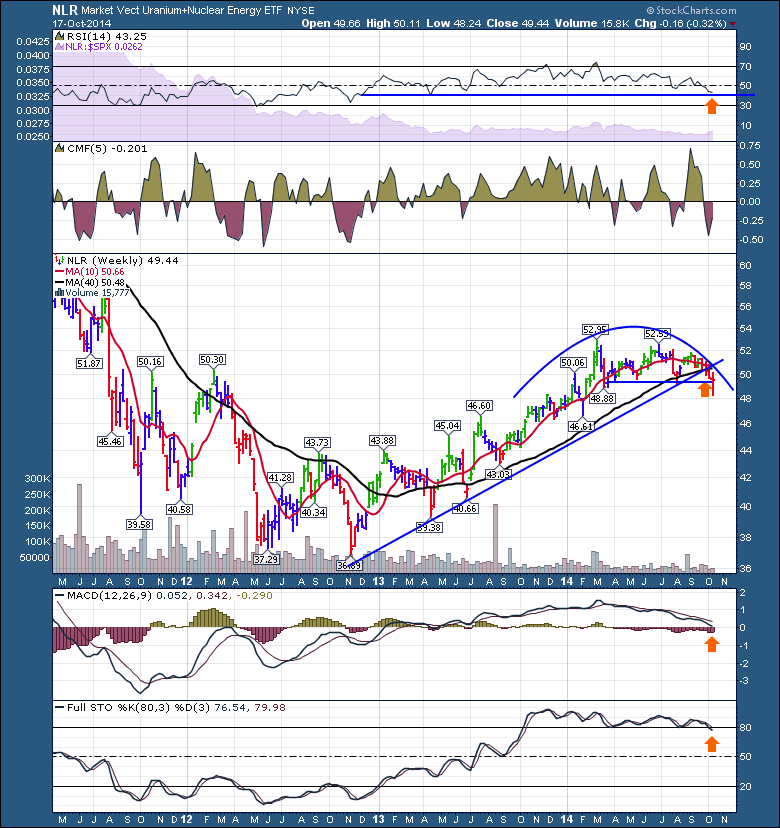
In this world of crosscurrents and 10% pullbacks, The Nuclear ETF (NLR) was no different. It has made about a 10% pullback off the highs.
But unlike the S&P 500 ($SPX), the NLR made it's highs in March not September. So while this looks the same it feels different. We have broken down through the support level and have competed a rounded top or double top. This is an important chart to watch right now.
Why now? Well, it closed back above the support level from the topping structure. All the weekly indicators are sitting at important levels like the MACD at 0, the Full Sto's right around 80 and the RSI in a bull market trend holds above 40. The CMF rose this week, so that is good news. The volume did not really change on this breakdown, so maybe its an investable low. Should this support level fail to hold, I would be very cautious expecting this sector to rise in the face of falling commodities in general. I am aware of the demand from China for Uranium and the whole picture on the number of new plants. But that's the story and this is the reality. It is threatening lower prices which means we'll have to wait for the story to play out some time in the future.
Good trading,
Greg Schnell, CMT

