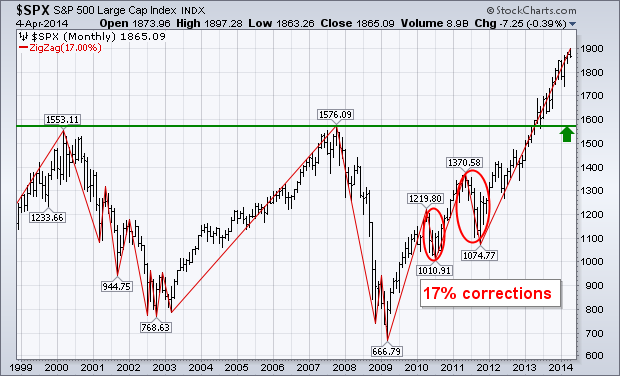
Last December 14 I wrote a message warning of the likelihood of a market correction during 2014. Midterm election years are the most dangerous of the four-year presidential cycle. ["The Four Year Presidential Cycle Suggests That 2014 Could Suffer a Major Downside Correction...The Strongest Six Month Period Ends in April"]. The message points out that midterm year peaks usually start in the spring. Since April ends the "strongest six month period" that starts in November, that makes April a good time to take some money off the table. It may also make the "sell in May" maxim more meaningful this year. The good news is that a major bottom usually takes place during the second half of the year (usually in October). Calendar-wise, we've now entered the dangerous spring season. That makes warning signs of a possible market top more meaningful. The monthly bars in Chart 1 show the S&P 500 rising above its 2007/2000 highs last spring to register a major bullish breakout. Those two prior peaks should act as major support below the market. Measuring from this week's intra-day high to the 2007 intra-day peak at 1576, an S&P 500 drop of 17% would bring it back to that major support level. That's probably the maximum correction we can expect. The red line shows the last two 17% corrections taking place during 2010 and 2011 (the 2011 correction of 19% lasted from May to October). The moral of the chart is that a correction as big as 17% would not disturb the market's major uptrend, and would most likely represent a major buying opportunity later this year.
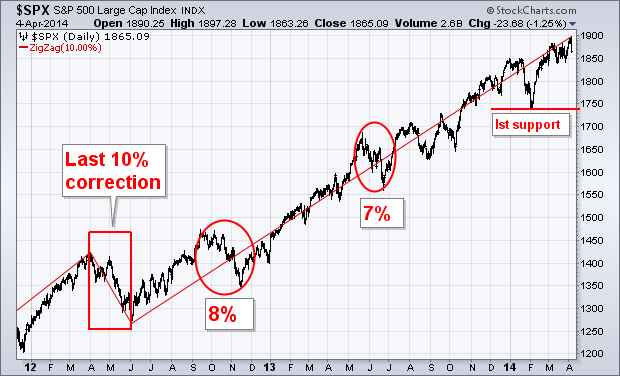
A LOOK AT RECENT S&P 500 CORRECTIONS... Chart 2 shows the last 10% correction in the S&P 500 (using intra-day prices) taking place in the spring of 2012 (during April and May). Two years without a 10% correction is unusual. A correction of 8% took place in the autumn of 2012, and a smaller 7% drop in the spring of 2013 (during May and June). An even smaller pullback of 6% took place this January. An S&P 500 drop to its early 2014 February low near 1740 would represent an 8% correction (see first support line). That's probably the minimum correction we can expect this year.


