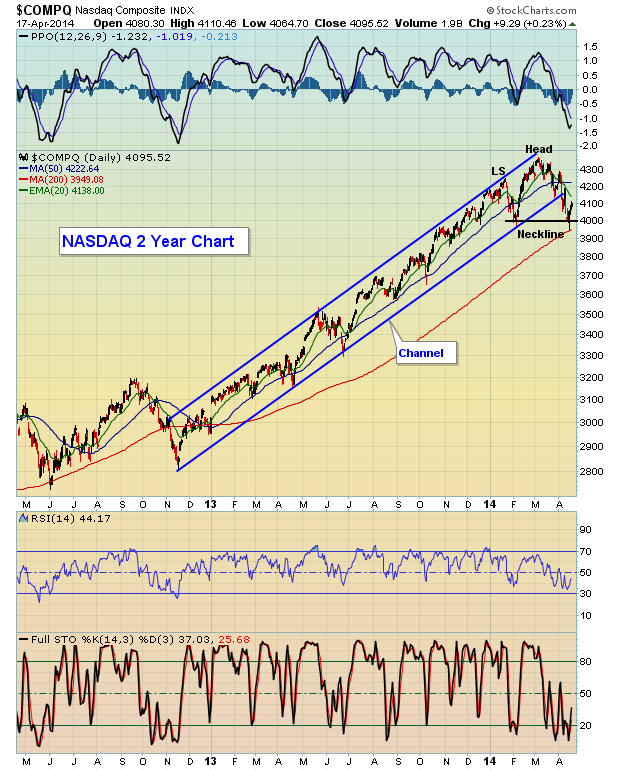
Last week's gains may have been more about options expiration and an oversold bounce than anything else. I have my eyes set squarely on the NASDAQ right now, waiting either for a resumption of the five year bull market or a breakdown of its current head & shoulders topping pattern that could spell LOTS of trouble ahead. I believe we're going to see the latter. Take a look at the chart:
That was a powerful channel that NASDAQ prices remained in for 17 months. Since the breakdown, however, the NASDAQ printed equal lows - February and April - to form a neckline. The current bounce is a potential right shoulder forming to test the declining 20 day EMA and/or become a backtest of the broken trendline. A failure at either and a subsequent break below neckline support at 3997 would likely result in much deeper selling. The head & shoulders pattern would "measure" to the 3650 area. That really wouldn't be too shocking if you consider that the NASDAQ rose more than 50% from November 2012 to March 2014.
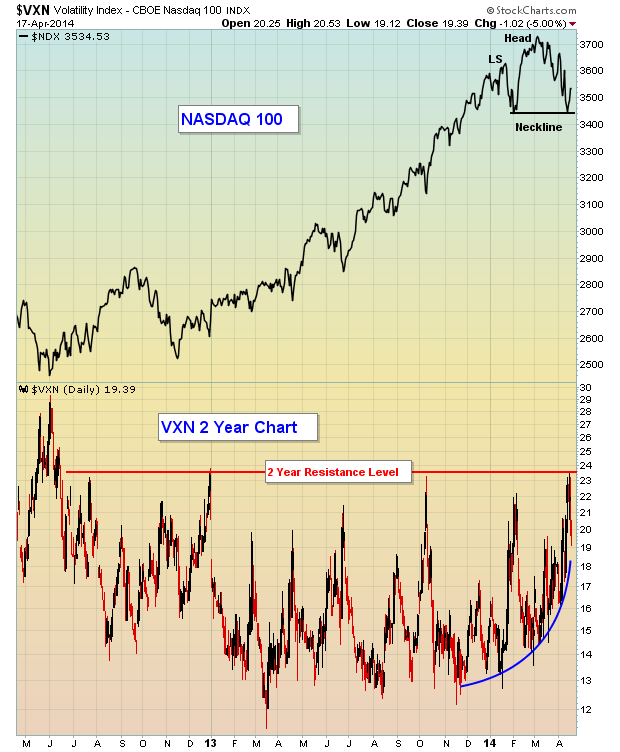
The flight to safety in 2014 is rather obvious to see. Since the S&P 500 hit its second peak at 1848 in mid-January, it's managed to tack on close to 1%, closing at 1864 on Friday. Over that time frame, utilities have gained 12%. Energy is up more than 8%. Consumer staples and basic materials are each up approximately 4%. The good news is that the S&P 500 is up year-to-date. The bad news is that all the wrong sectors are leading the charge. It's this rotation to defensive stocks that leads me to believe the current rally will be short-lived. Over the past several weeks, we're seeing more and more impulsive selling take control of the market and volatility has soared. The NASDAQ 100 Volatility Index ($VXN) spiked to test an intermediate-term resistance level as reflected in the chart below. Should the NASDAQ lose the neckline support identified above AND the VXN close back above 23, we're likely to have a panicked market on our hands. Unfortunately, we remember all too well what that means for our portfolios, so take necessary precautions if we head down that path. Check out the VXN:

Note that the expected volatility began to rise BEFORE the NASDAQ 100 topped. That expected volatility was a warning sign and now we have a topping pattern in the form of a head & shoulders formation. The combination of a high volume, bearish breakdown of this pattern, accompanied by soaring volatility expectations would suggest at least the possibility of a very quick and significant selloff at some point in the not-too-distant future.
I believe it's better be to safe than sorry, and that's exactly the message the market is sending right now in terms of sector rotation. My Monday Chart of the Day will focus on an ETF from the ProShares product line that concentrates on large companies paying and raising dividends - in other words, a more conservative and diversified income strategy that's been working well in the current market environment. For more details, CLICK HERE.
Happy Trading!
Tom Bowley
Chief Market Strategist
Invested Central

