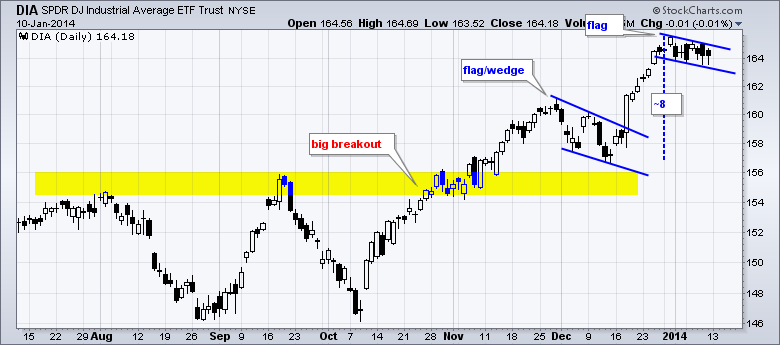
The Dow Diamonds (DIA) and several key stocks within the Dow formed bullish continuation patterns over the last two weeks and traders should watch these patterns for breakouts. DIA formed a falling flag and this pattern represents a rest after a sharp advance. Such a rest or pullback is actually healthy because it alleviates short-term overbought conditions. We could use a momentum oscillator, such as the Stochastic Oscillator or the Commodity Channel Index (CCI) to quantify overbought conditions, but a simple look at the price chart shows us that prices moved quite far quite fast. DIA was clearly overbought after a 5+ percent surge in just eleven days during mid December. Also note that DIA is up around 12 percent since early October, a mere three months ago. Even though I am concerned with medium-term overbought conditions and the possibility of a deeper correction, note that a move above last week's high would break flag resistance and argue for a continuation of the December surge. Yes, DIA is overbought and could become even more overbought. Based on a flag flying at half-mast, the upside projection would be to the 171 area (163 + 8 = 171).

Click this image for a live chart
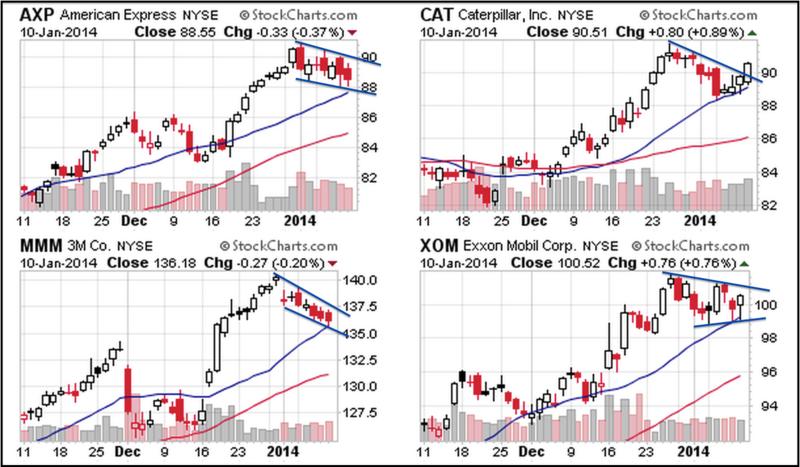
The Dow is a price-weighted average of thirty stocks, which means the stocks with the highest prices carry the most weight. With prices above 175 dollars per share, Visa (221.13), IBM (187.26) and Goldman Sachs (178.39) are the big hitters in the Dow. With prices well below 30 dollars per share, the influence of Cisco (22.22), Intel (25.53) and General Electric (26.96) is way overshadowed by the three highest price stocks. Chartists looking for an edge on the Dow should focus on the highest priced stocks. Even though the four stocks below are not the highest priced, they are priced high enough to exert some serious influence. I picked these from the Dow CandleGlance charts because all four have bullish continuation patterns taking shape. CAT is already making a breakout bid. Chartists should also watch AXP, MMM and XOM for potential breakouts in the near future.

Best wishes for 2014!
--Arthur Hill CMT
