Hello Fellow ChartWatchers!
Well, 2013 is almost over - this is the last ChartWatchers newsletter until 2014 - and I thought now would be a good time to review some of the key technical developments during the past year.
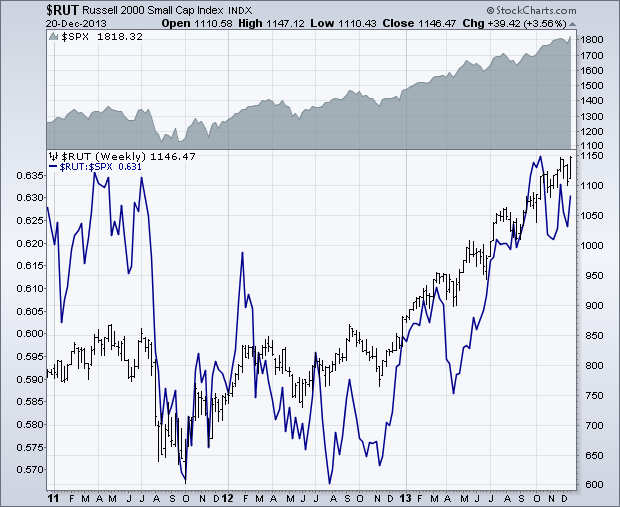
Things got off to a good start as stocks surged higher in early January when the "Fiscal Cliff" situation in Washington appeared to be resolved. That sent small-caps into record territory where they stayed for essentially the entire rest of the year. Small-caps outperformed large-caps during much of 2013 - a situation that was under reported by many financial news outlets (but not us).
Here's an updated version of a chart John Murphy created back on January 3rd when he was pointing out the strength in small-caps.
That was a great call on John's part because - as today's chart shows - $RUT continued to out-perform and move higher throughout 2013. Our Market-cap PerfChart confirms that as well.
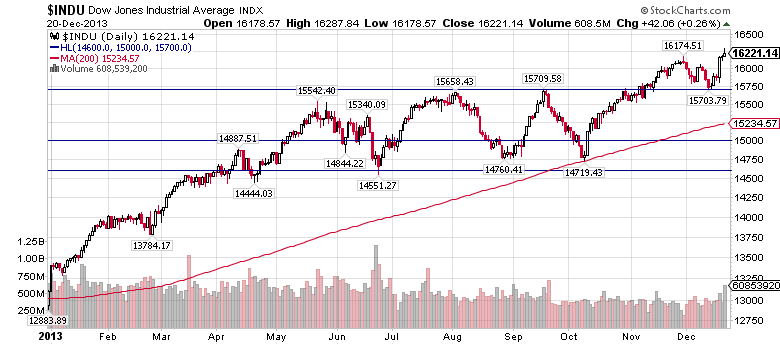
The Dow broke above 15000 in May but ran out of steam around 15500 later that same month. It then essentially moved sideways in a large trading range between roughly 14600 and 15700 testing both levels several times. After testing its 200-day MA in October it finally broke through the 15700 resistance level in mid-November. It then went back and tested 15700 as a support level just last week. Currently $INDU is setting new highs once again - a good overall sign for the market.
In many ways, 2013 was a classic "wall of worry" scenario where stocks generally moved higher despite the constant drumbeat of bearishness from the "pundits." Technicians who stuck to their charts should have profited handsomely as stocks (especially small-caps) moved higher and higher over the course of the year. Investors who ignored the charts and over-focused on the negativity in the financial press were left behind.
Again, there are still several more trading days left in 2013 but you can use these PerfCharts to see the winning sector, the winning capitalization, and the winning major index - just click the link, then right-click the "200 day" thumbnail below the chart and select "Year-to-date" from the dropdown.
As always, my New Year's resolution will be to focus on the message that the charts are telling me - not the "talking heads", not the "pundits" - but the actual trading action on Wall Street that's reflected in my charts. Here's hoping that 2014 is even more profitable for ChartWatchers everywhere!
- Chip
P.S. Don't forget to take advantage of our Holiday Special before it ends on Dec. 31st!


